A one-stop-shop for data, analytics, and insights, Kpler is trusted by physical and financial market players to empower their decisions with confidence and speed.
trusted by thousands of organisations worldwide


.webp)


Prices
France (by power types)
48
European countries
46
Day short term forecast horizon
190+
Proprietary curves
Long term
forecast horizon
- Storage Level Clarity: Stay informed on gas and hydro storage levels, critical for markets reliant on these energy sources.
- Plant-level Visibility: Track outages, availability, and generation units with an intuitive, interactive map.
- Bidding Zone View: Effortlessly switch views to monitor European spot prices and influencing fuel factors.
- Availability Forecasts: Analyze forecasts by country or plant, extending up to two years, with interactive tools highlighting fuel mix insights.
Request demo
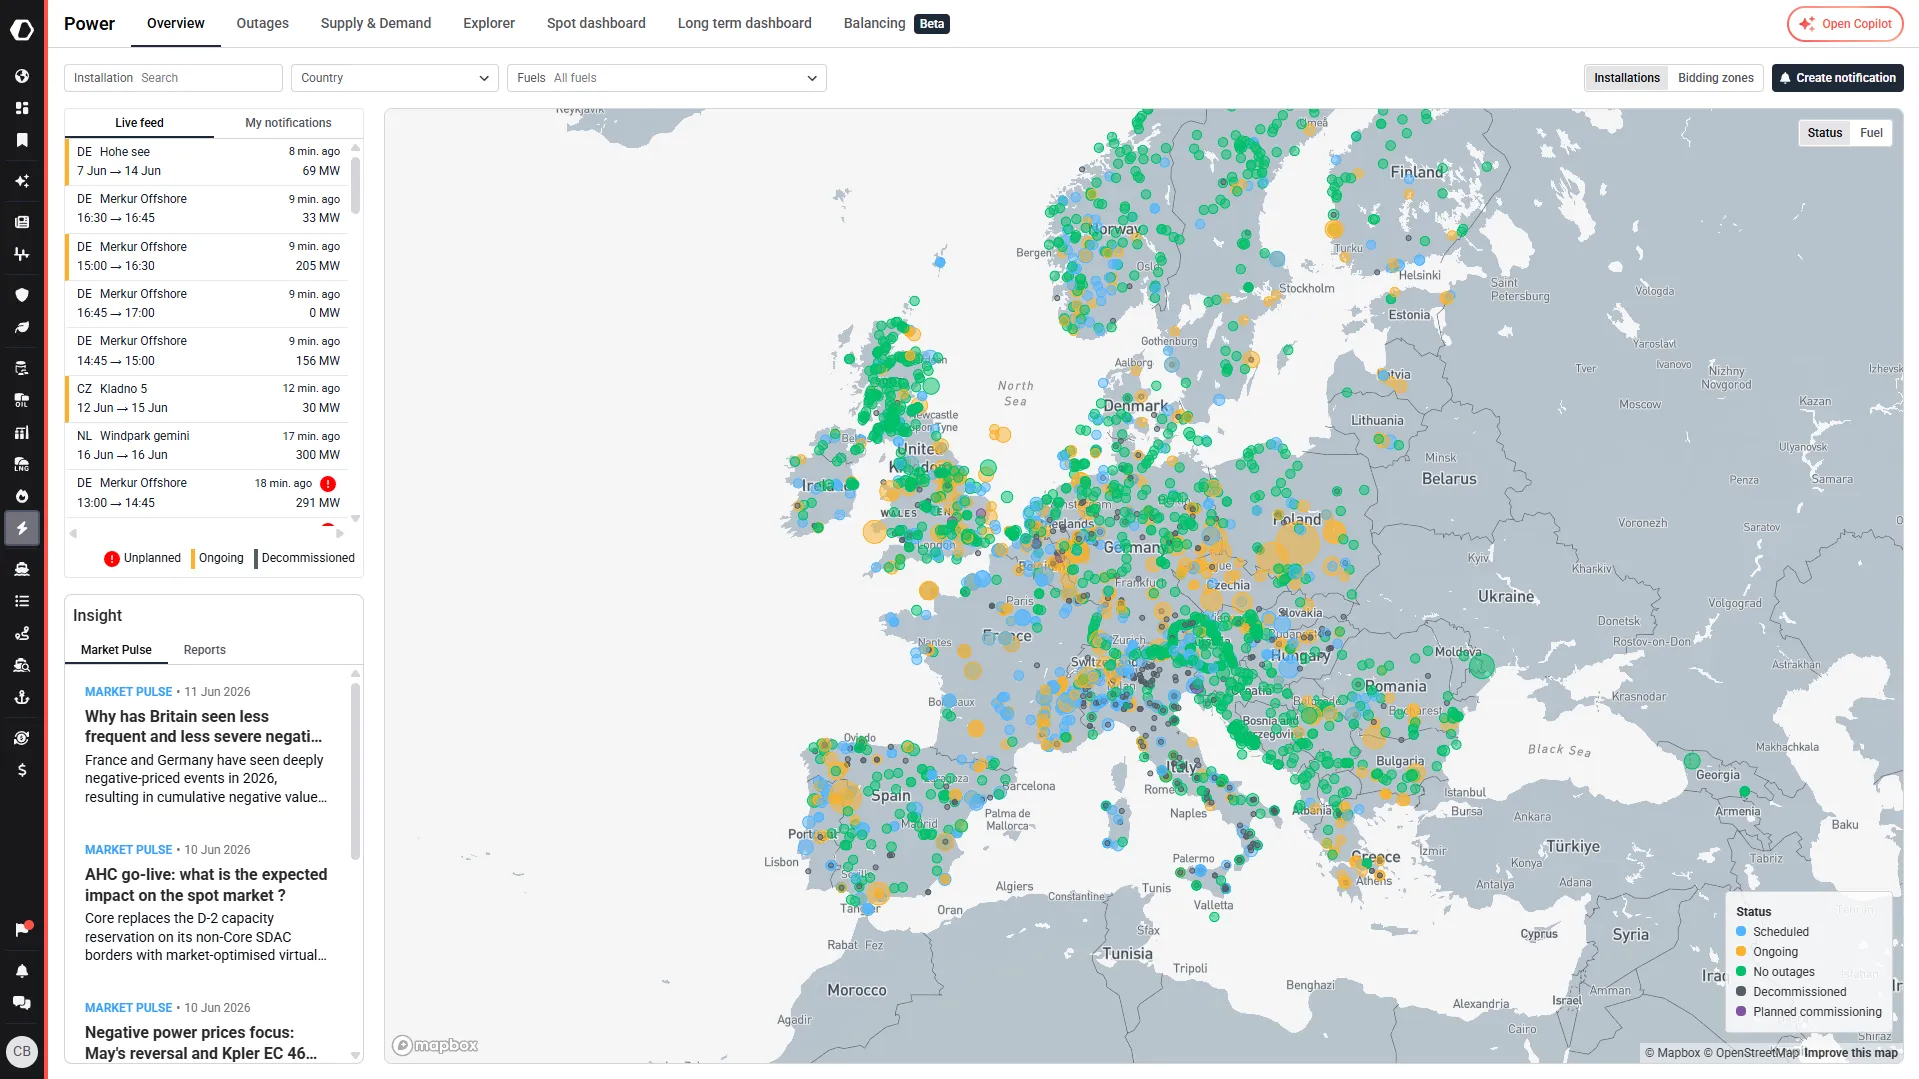
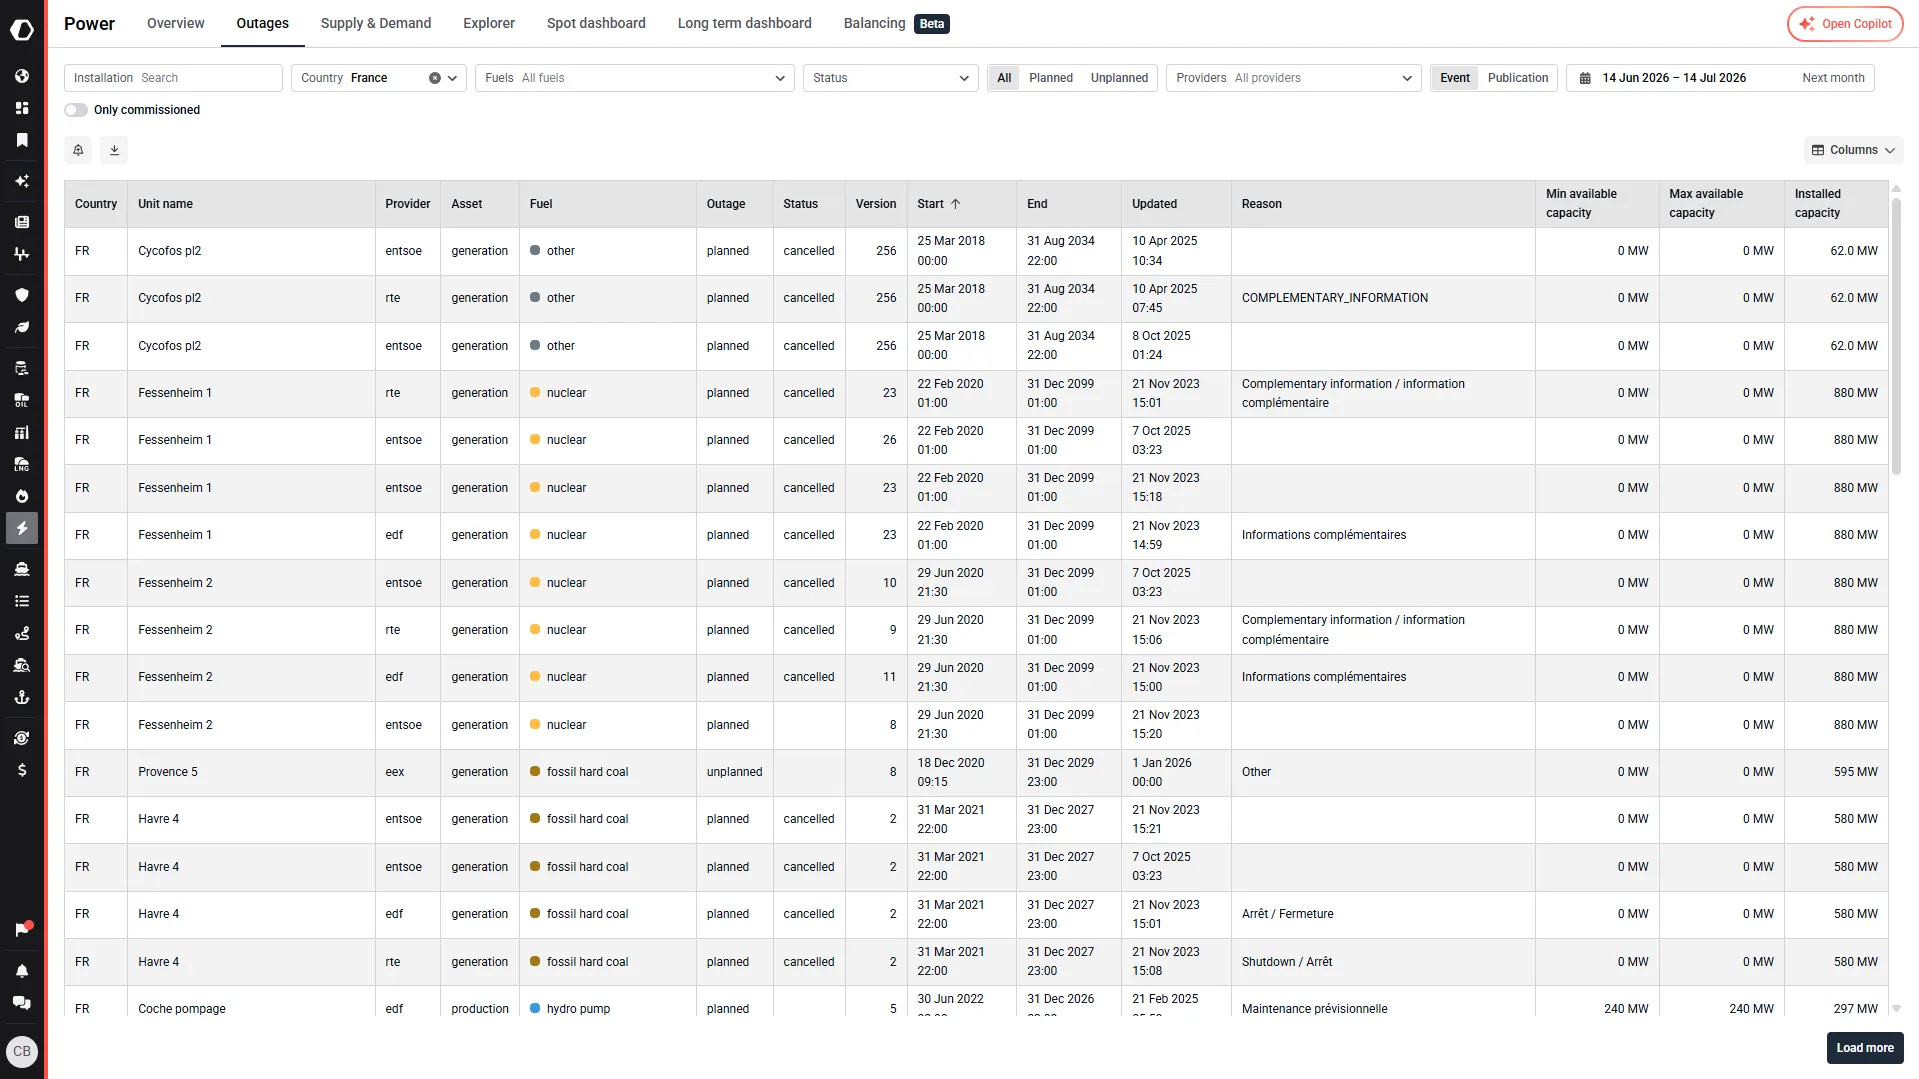
- Transparent Outage Insights: View precise outage timings, including start, end, and update timestamps, alongside ramping rates and outage reasons for full clarity.
- Historical & Forecasted Data: Analyze supply stacks with detailed forecasted, real-time, and historical outage data from 2015–2028 across 48 markets, down to the unit level.
Request demo
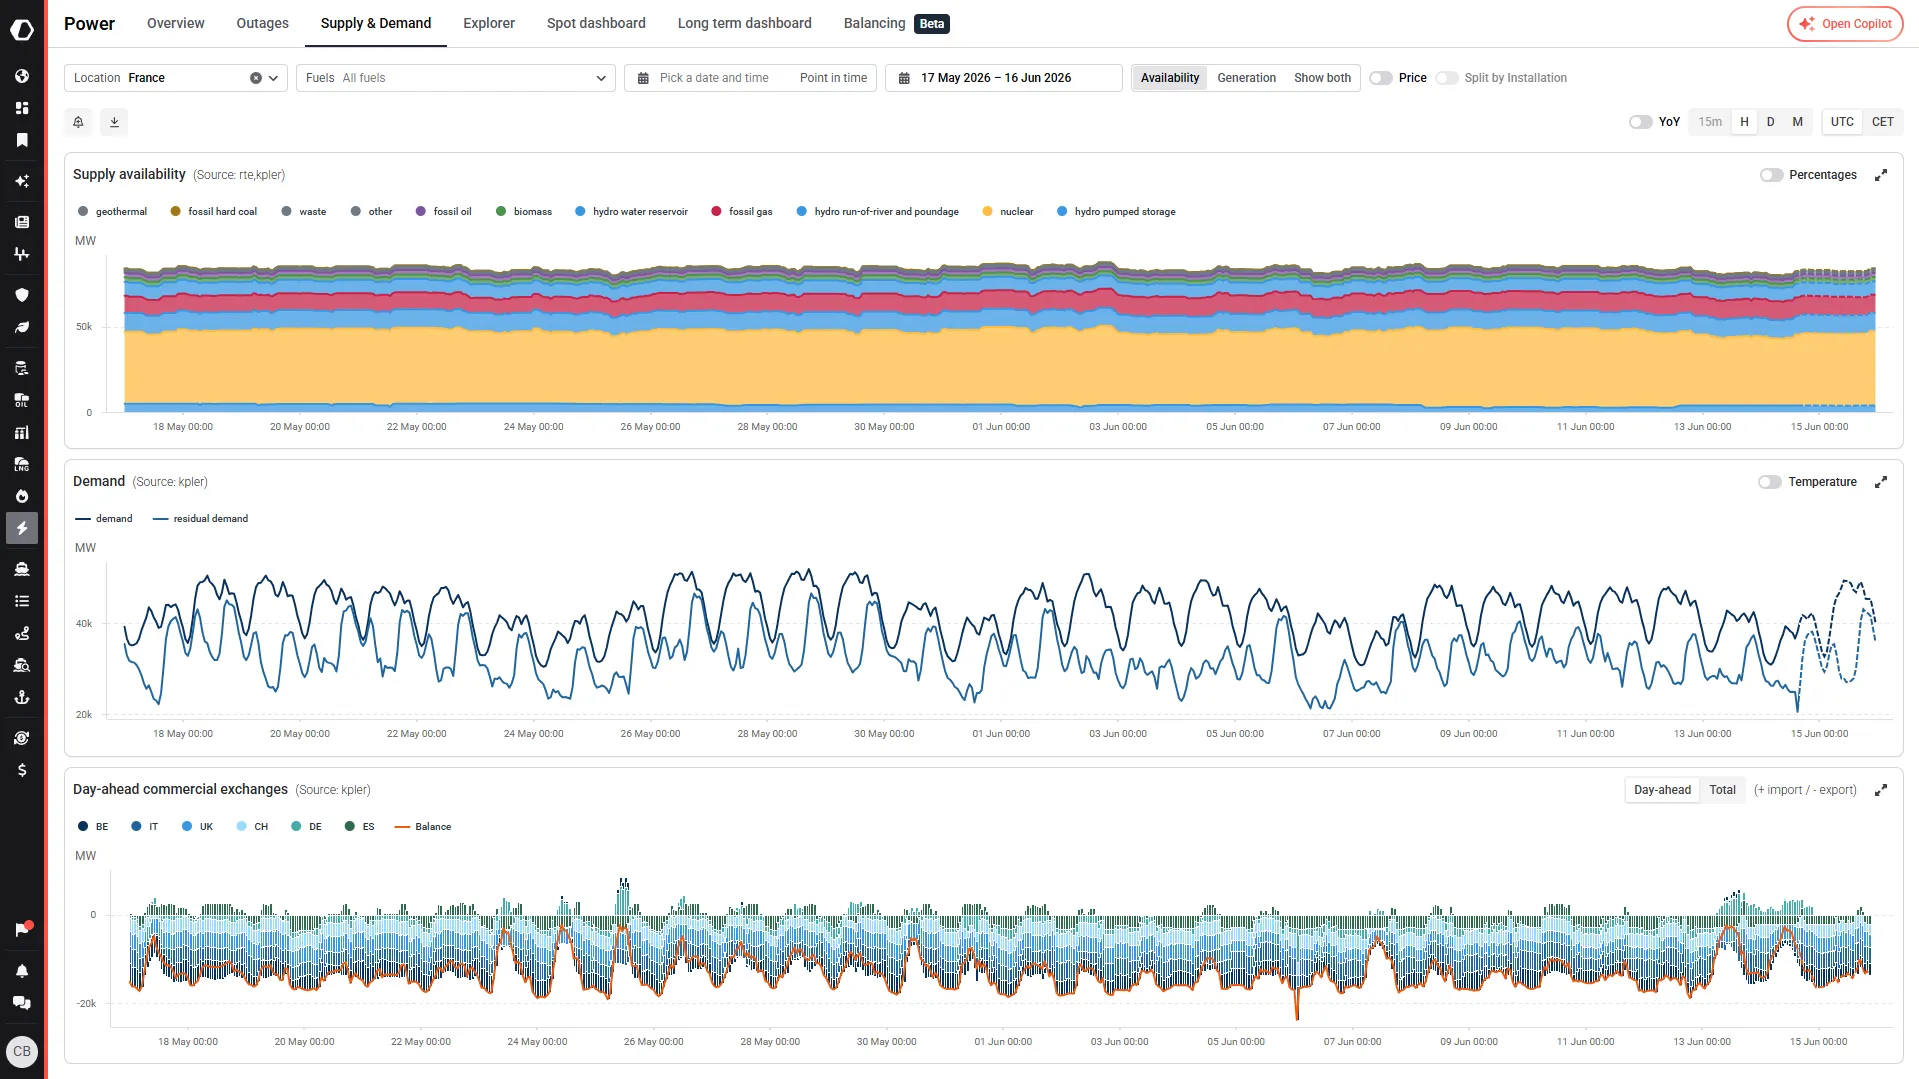
- Price Integration: Overlay market prices to connect price movements directly to fundamental market data.
- Real-time Market Trends: Instantly identify trends shaping the interconnected European power market.
- Detailed Filtering: Explore analytics by individual countries, regions, fuel types, and specific timestamps.
- Demand & Mix Visualization: Simultaneously visualize electricity mix, residual demand, temperature data, and day-ahead commercial exchanges for rapid insights.
Request demo
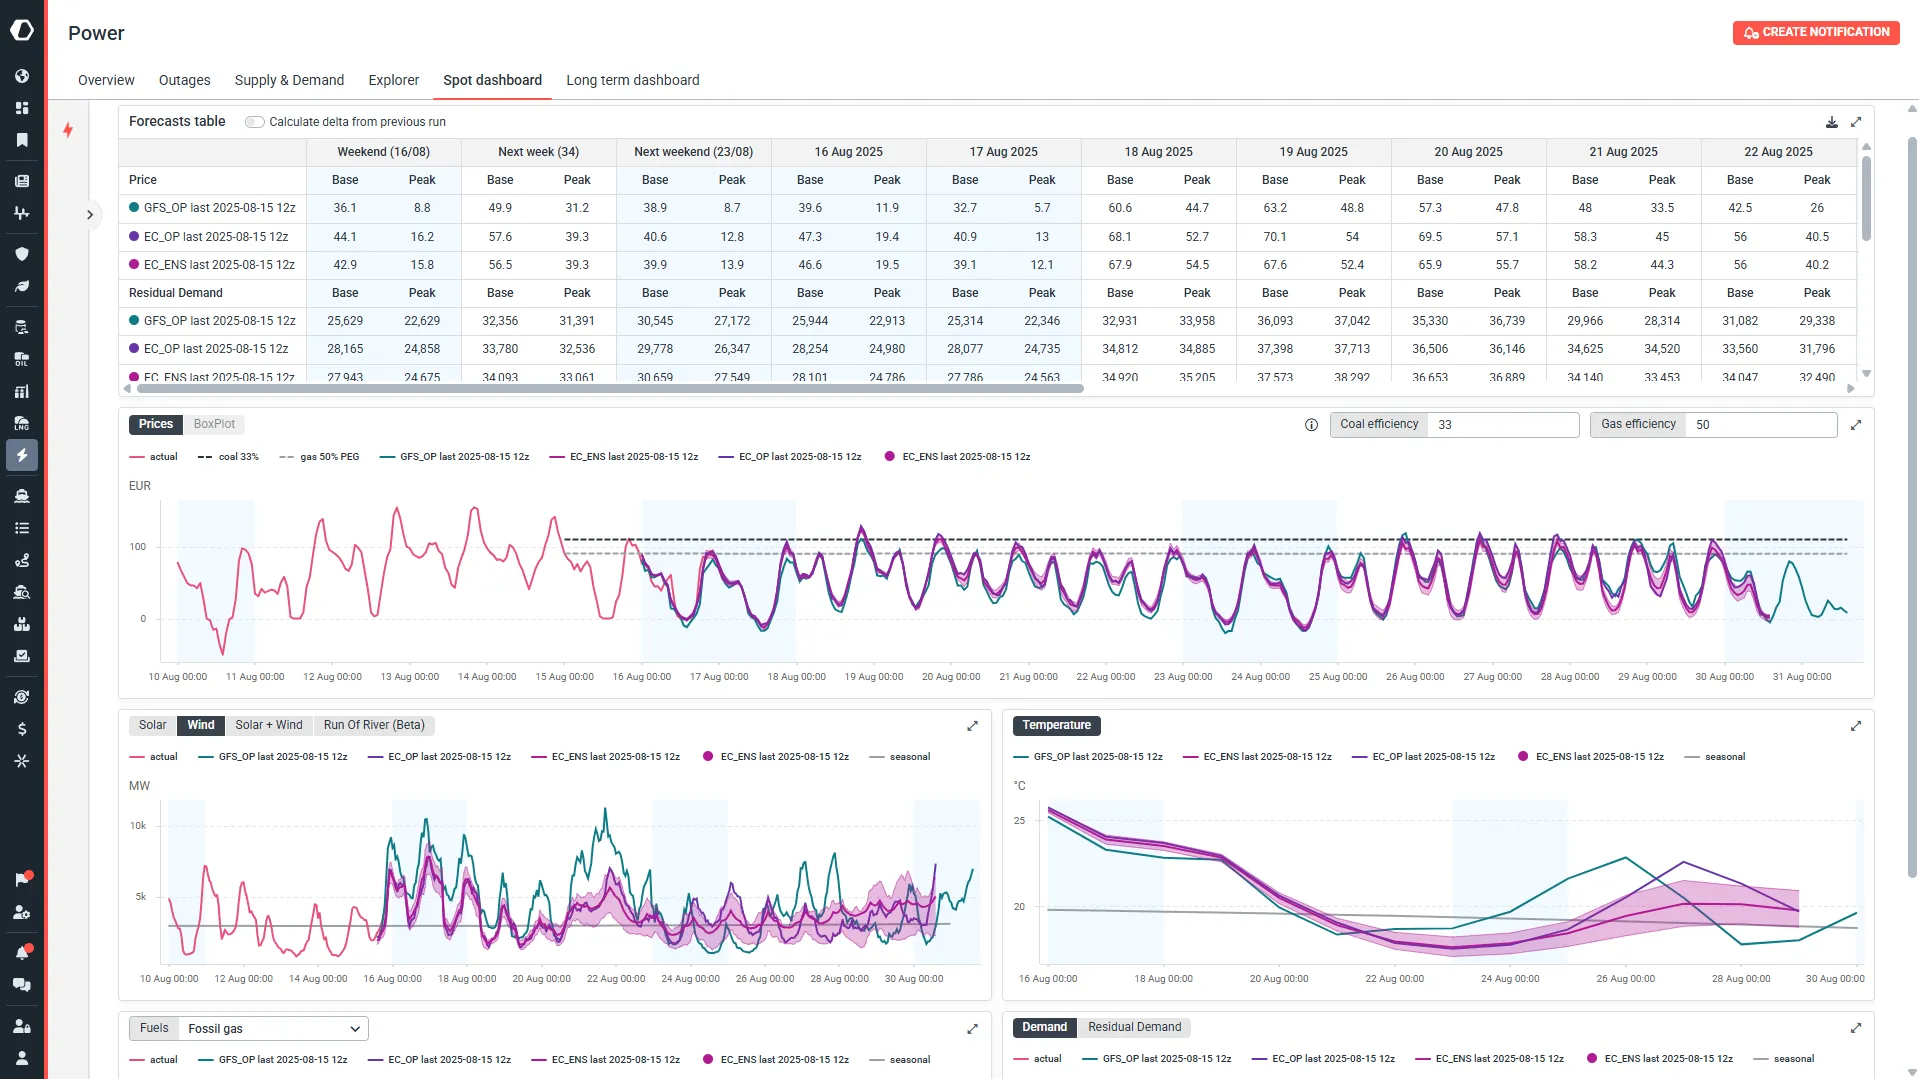
- Interactive Price Analysis: Customize coal and gas efficiency scenarios to model short-run marginal costs accurately.
- Spot Market Insights: Access short-term forecast models for price, load, and renewable and fossil-fired generation forecasts up to five days ahead.
- Forecast Evolution: Easily compare current and previous forecasts to analyze weather-driven changes.
Request demo
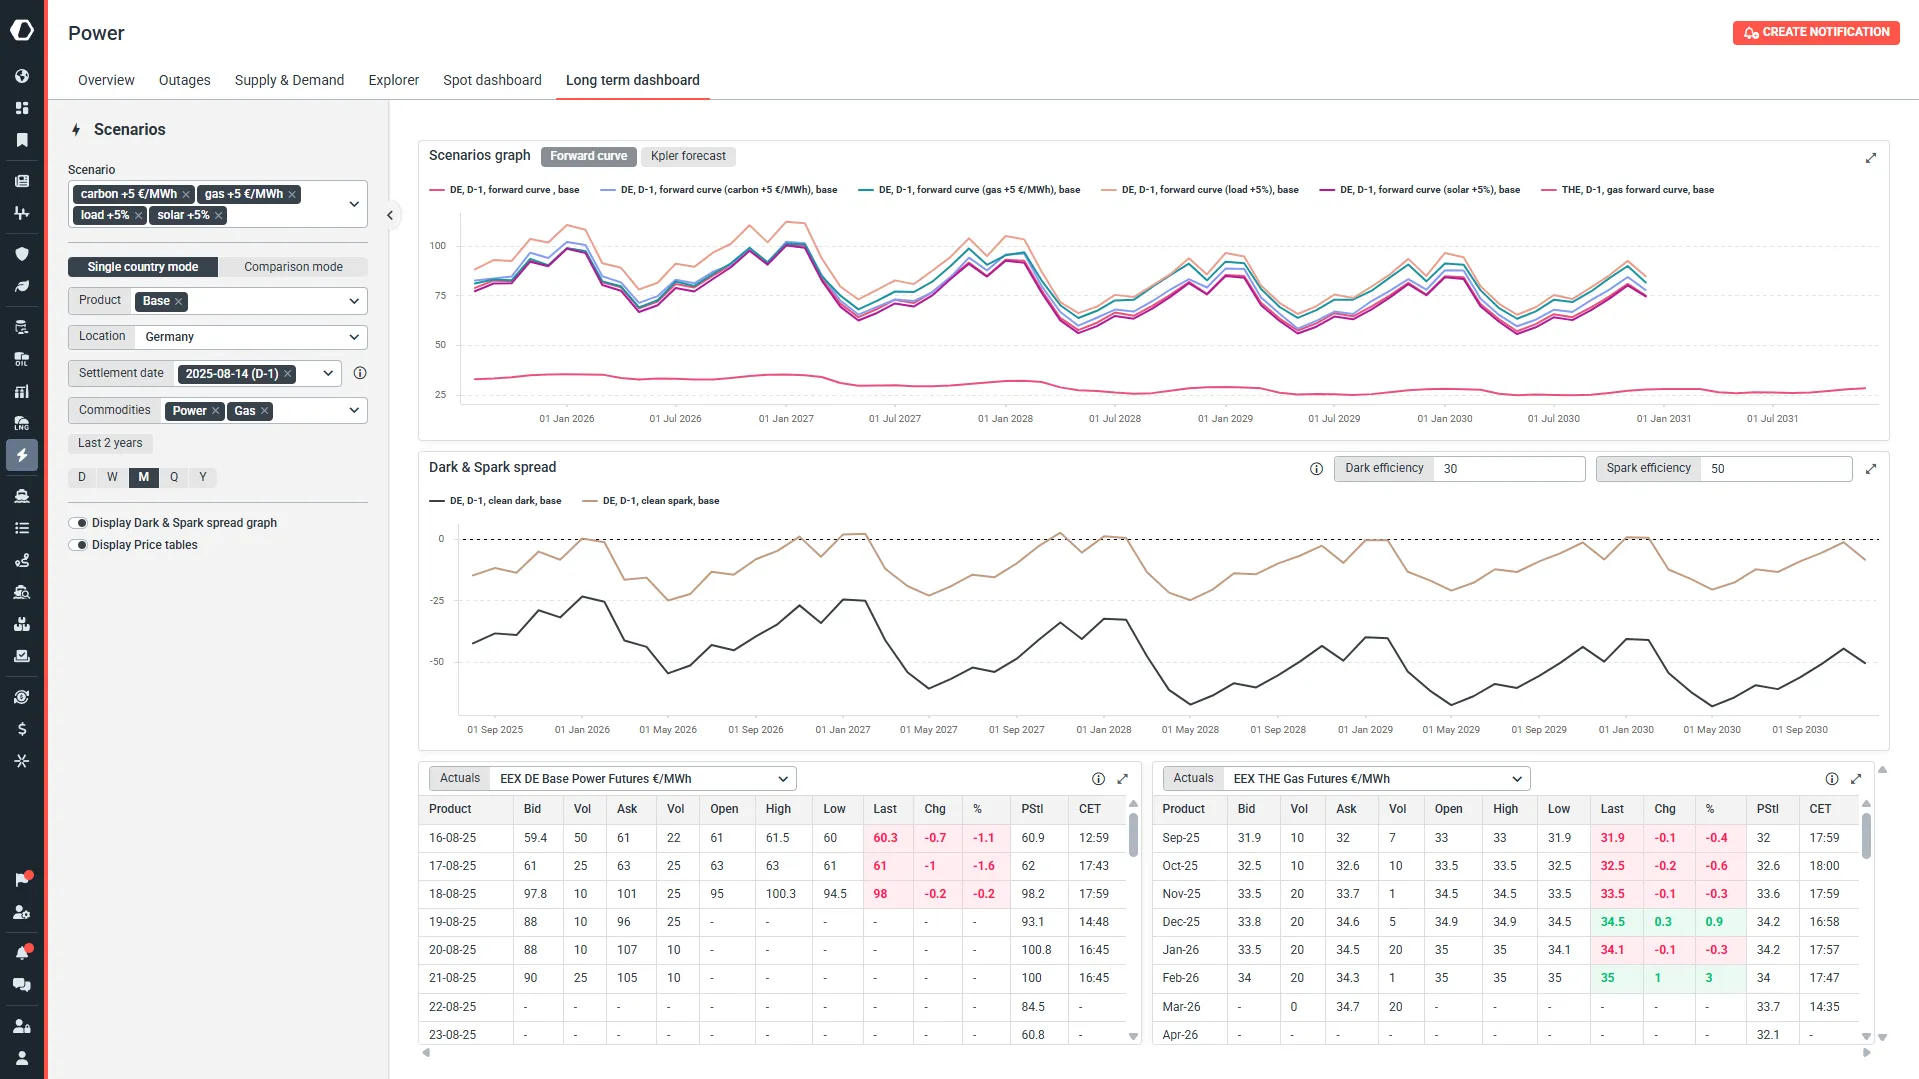
- Comprehensive Pricing Visibility: Track price movements across major markets, including base, peak, and gas futures, for extensive scenario comparisons
- Five-Year Forecast Tool: Quickly develop scenarios modeling variations in fuel types including carbon, gas, and renewables.
- Advanced Scenario Analysis: Use filters for base and peak products, settlement dates, and power/gas curves, with robust cross-country and forward curve comparisons.
- Financial Indicator Insights: View and adjust dark and spark spreads to precisely analyze economic impacts.
Request demo

“Kpler is one of the few truly objective research outfits. No agenda, just data-driven insights.”
BNP Paribas
Commodity Strategist, BNP Paribas