trusted by thousands of organisations worldwide


.webp)


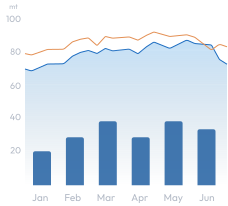
LNG utilization vs import
Global
211
installations tracked
10+
European countries tracked
4+
Non-European countries tracked
- Historical data since 2009, which reveal operational trends, outages, emerging market dynamics.
- Forecast data several years ahead, giving insights into Kpler's research view of upcoming project developments.
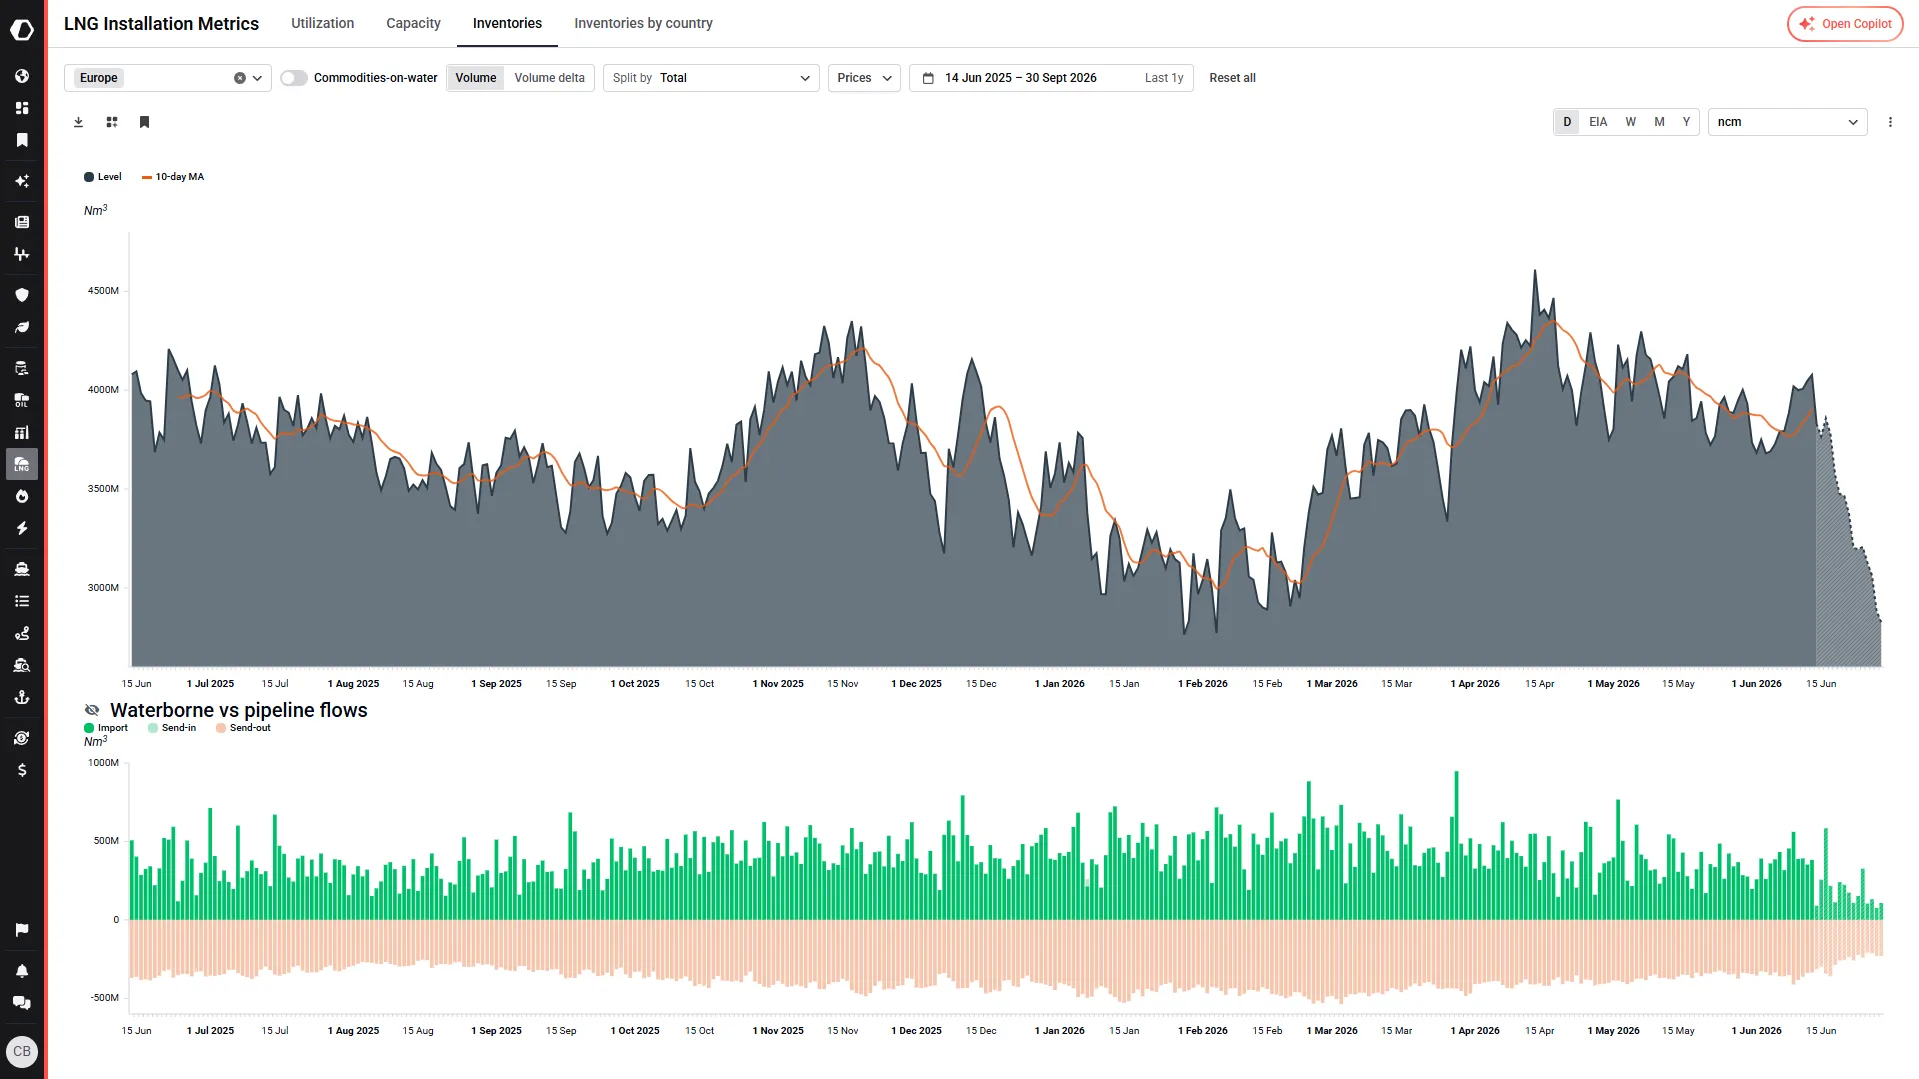
- LNG inventories for all major LNG inventory sites, as well as at country-level (since 2017, with several weeks of forecast), providing guidance into trading-horizon LNG and gas fundamental analysis.
Request demo

- Nominal capacity per installation
- Changes in the last 30/60/180 days
- Trend indicators and YTD changes in utilization
Request demo

- Nominal capacity data and active installation counts
- Forecasted capacity 10 years ahead
- Live statuses whether a unit/train is active, under construction, planned & proposed, suspended, mothballed, or decommissioned
Request demo

- Europe: track historical installation-level LNG inventories, LNG send-out, and LNG imports, and see how expected vessel arrivals from Kpler's destination forecast algorithm may impact LNG inventories in the coming weeks.
- Eastern Asia: track historical country-level LNG inventories for Japan (including a power vs non-power split) and South-Korea, combining national statistics with the nowcast coming from Kpler's high-performing country-level supply & demand balances (see Supply & Demand).
- Russian FSU: track the filling level of the two Russian FSU facilities in Murmansk and Kamchatka, which constitute key pieces of infrastructure linked to the Arctic LNG 2 export installation.
- Australia /United States: track historical installation-level LNG feedgas (LNG send-in), LNG exports, and estimated LNG inventories, and see how expected vessel arrivals from Kpler's destination forecast algorithm may impact LNG inventories in the coming weeks.
Request demo
- Track planned and unplanned maintenance events for individual installations, including starting date, duration, and outage notes from Kpler’s own analysts detailing circumstances resulting in outage events.
Request demo


“Best part? Kpler dashboards. I set up my metrics once, and they update in real-time. I can access the latest insights instantly.”
Broadview Capital
Director of Energy Research, Broadview Capital