


Using Kpler Refineries to predict earnings metrics
The below share the results from a partnership between Kpler x Exponential Technology to produce analytical work that showcases the power of Kpler’s datasets.
Exponential Technology is a leader in advanced data analytics and signal research with 25 years of institutional investing experience. Their team of quantitative researchers and experienced traders specializes in building predictive models that consistently beat consensus estimates—making them the ideal partner to demonstrate the investment applications of Kpler's Refineries data.
Kpler’s Refineries product delivers daily data across 900+ refineries globally. Within that data, users are able to extract company mapped data for each of their respective refineries. Data such as refinery runs, in addition to utilisation rate, events, capacity and refined product production are all available for each refinery that Kpler tracks. Given that this data is updated each day, and that the product ingests real-time outage information and adjusts the data based on the impact of said outages, the product provides enough information to build a signal that can provide insight into publicly traded refining company’s key operating metrics weeks ahead of reported earnings.
Kpler and Exponential Technology will be releasing a white paper in the coming month that will dive deep into the type of earnings and equity analysis that can be done using the Kpler Refineries product. The white paper, co-authored by Kpler's product team and Exponential Technology's quantitative research team, will include detailed methodologies, additional refinery case studies, and frameworks for applying this predictive approach to other sectors and companies.
This blog will take a look specifically into one of the companies that was examined in the whitepaper to demonstrate the predictive power of Kpler’s data. In this blog we will walk through building a model to predict Phillips 66’s (PSX) earnings metrics.
Part 1
Kpler Refineries provides several key metrics that investors can use to build predictive earnings models. Among other data, it provides:
- Daily refinery runs
- Daily refined product production
- Company level mapping
- Utilisation rates
Kpler is able to take advantage of real-time events and updated capacities that enable the product to reflect the corresponding impacts on runs, utilisation, & production rates. By having runs and production data updated daily, it ensures that users will be able to track these metrics faster than other providers that only offer part of this picture or operate on more significant delays.
Exponential Technology's analysis of PSX discovered that the refining business segment represents 76% (historical average) of their total revenues, suggesting that Kpler’s refining data may prove to be an outstanding candidate to predict this crucial number.
Further, PSX provides via 10Q and 10k SEC filings their refining operations metrics broken up geographically and worldwide. The first step for Exponential Technology's research team in building a model that can provide insight into future earnings metrics is to extract the same refining metrics from Kpler’s database via downloading it directly from the web application, using the Excel Add-In or through an API. In this case the daily refinery runs data mapped to PSX’s refineries. While Kpler’s full historical data goes back to 2017, for this case we are using the daily historical data that Kpler provides going back to January 2020.
Once the data was extracted, Exponential Technology's quantitative analysts aggregated this data into quarterly buckets in order to align with Phillips 66 earnings reporting cadence. With this data extracted and aggregated, we can move onto the next step.
Part 2
This next step involves extracting data from PSX’s 10-Q and 10-K in order to find the corresponding metrics that can match with what Kpler Refineries provides. Specifically, in this case Phillips 66 reports on “refinery production” for each of its quarters, and does so for each region it operates within - such as Atlantic Basin and Gulf Coast. Kpler provides its data in KB/D - thousands of barrels per day, which is also the unit that Phillps 66 uses. In order to align the data properly, the total KB/D number that Kpler provides for the equivalent “refinery production” needs to be aggregated by quarter. So taking into account the Kpler daily numbers, these need to be summed up and then divided by the days in the quarter to retrieve an average. For this example, Kpler ran this alignment for each of the previous 5.5 years, and mapped each quarter’s Kpler refinery run KB/D average on top of each quarter’s Phillips 66 refinery run KBD.
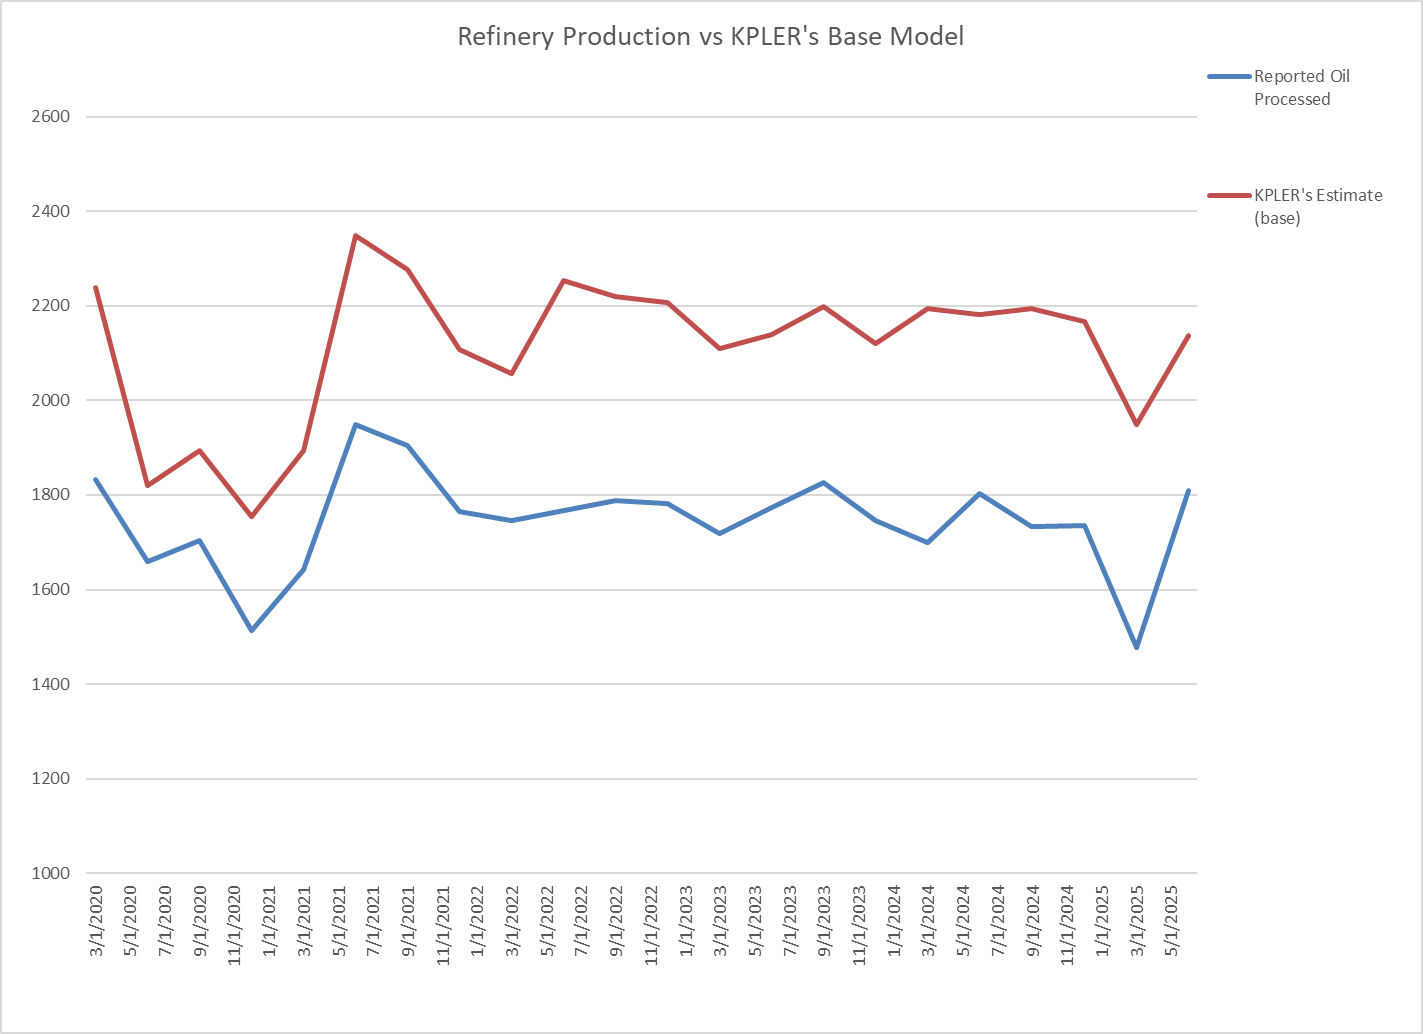
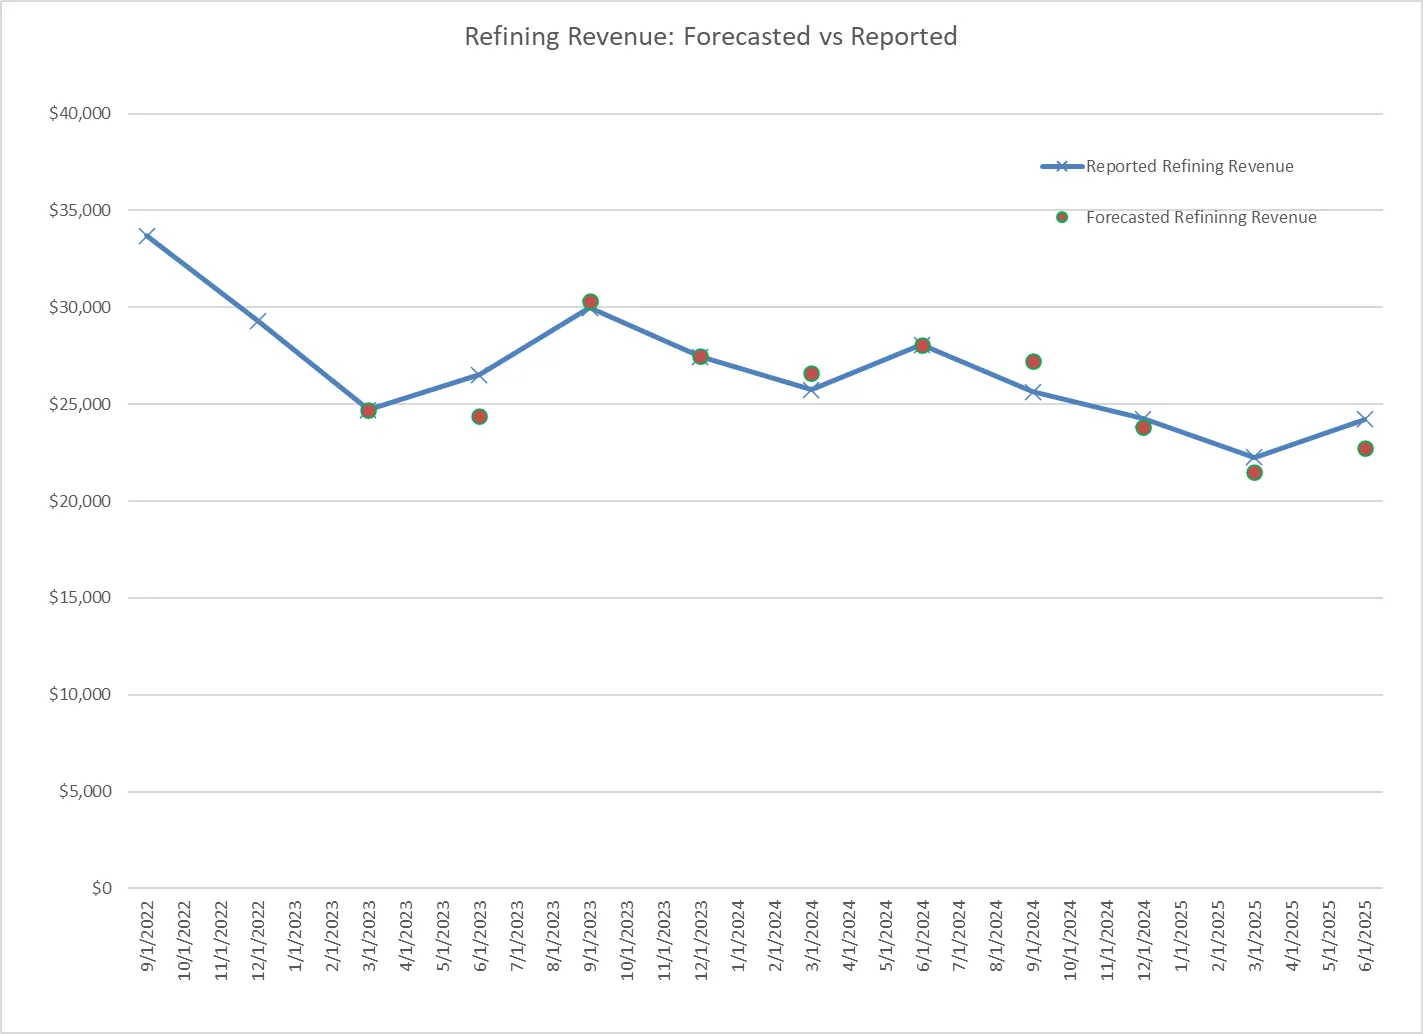
When conducting this analysis, Exponential Technology's team observed that Kpler’s reported refinery run numbers were consistently higher than those reported by PSX. At first glance, this discrepancy might suggest that Kpler’s data is inaccurate. However, visualizing the two series reveals that their trajectories are strikingly similar. Indeed, the cosine similarity between the two vectors is 0.9992, indicating that they share an almost identical pattern of change over time. This near-perfect directional alignment suggests that, although Kpler’s estimated levels are biased upward relative to PSX's reported figures, the underlying dynamics of change are being captured well. To quantify this relationship, we evaluate the base model’s accuracy using mean absolute percentage change (MAPE). The base model’s quarterly estimates exhibit a MAPE of 20.5% relative to the reported figures. However, by explicitly correcting for the systematic tracking error, we construct a simple “error tracking model” that forecasts future quarterly average processed oil (Kb/d). This adjustment yields a dramatic improvement, reducing the MAPE to just 4.94%. The chart below shows the new tracking error model’s estimates (green dots) compared to the reported and base model’s figures.
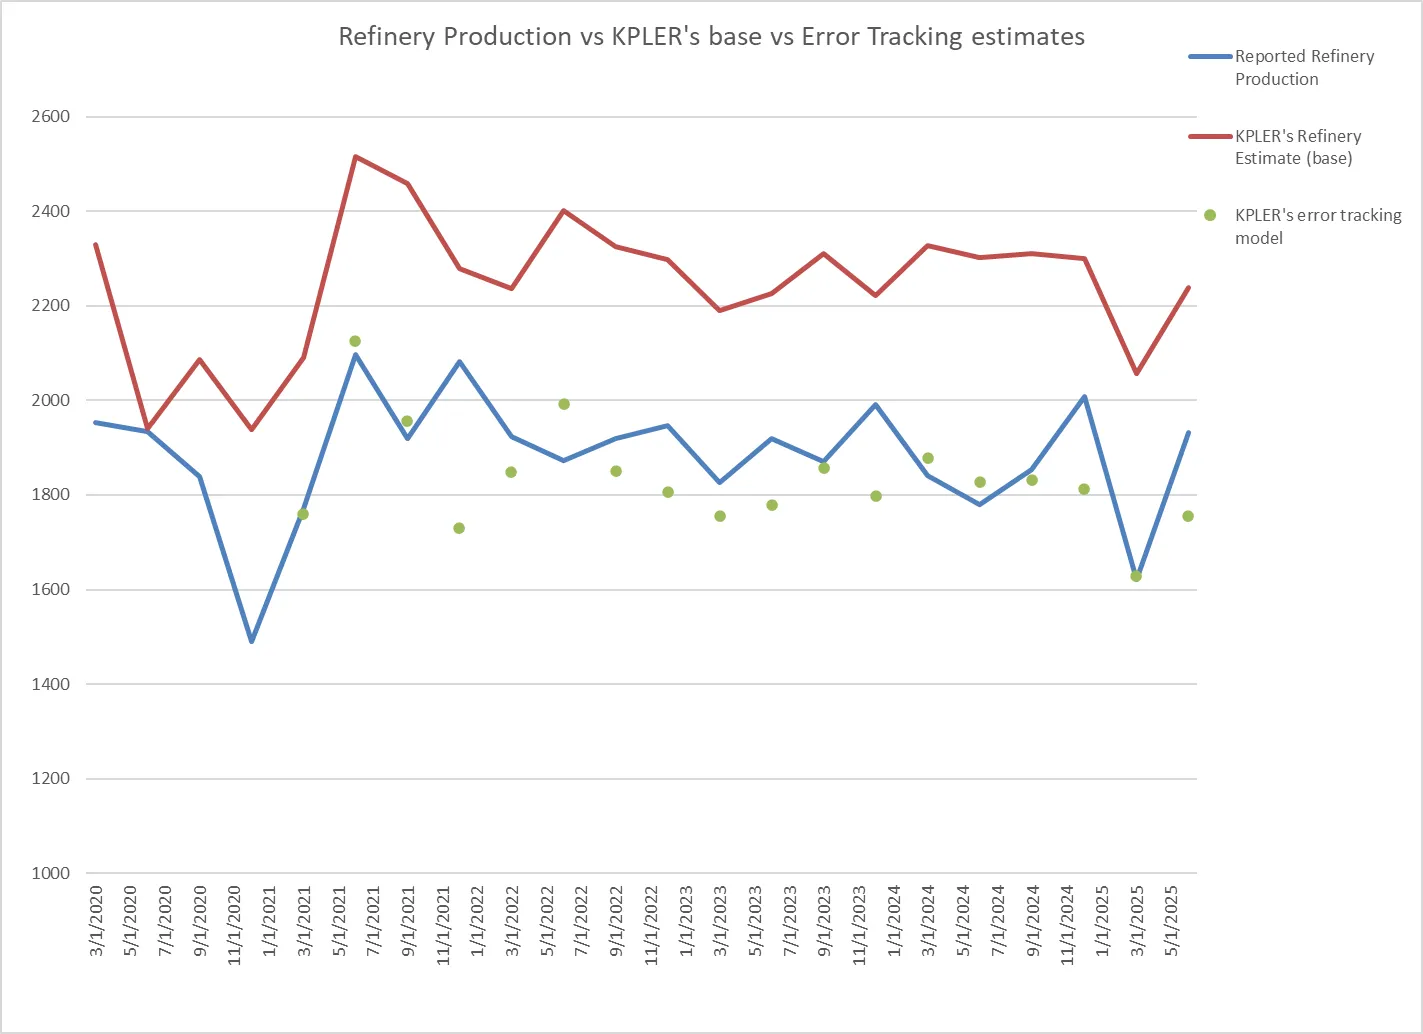
We can conclude that the error tracking model tracks the reported line much closer with several estimates at near perfect estimates. Although, the error-tracking model appears to over-correct the base model with predominant estimates below the reported figures.
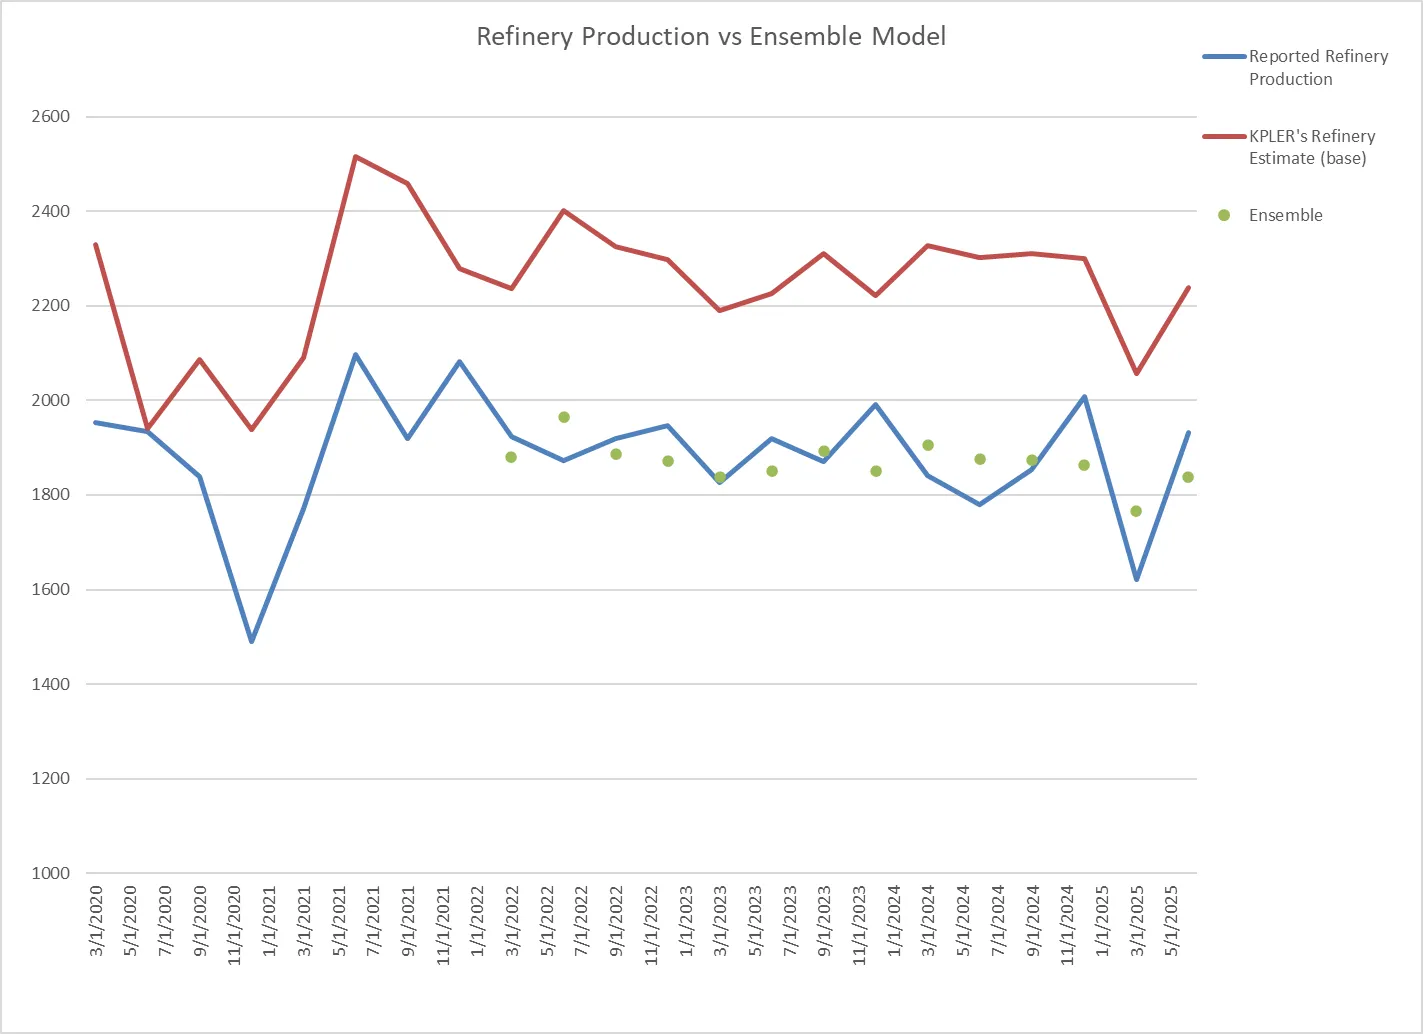
To further refine the analysis, Exponential Technology developed a suite of models leveraging various machine learning methods to improve estimation accuracy. Their proprietary ensemble modeling techniques, honed over 25 years of institutional investing, combine multiple algorithmic approaches to eliminate bias and improve prediction accuracy. These models relied exclusively on predictive features derived from the reported figures and Kpler’s base estimates for processed oil (Kb/d). Importantly, the models employ an auto-regressive framework, ensuring that each estimate is generated “out-of-sample.” The various models are combined to create an “ensemble model” to predict next quarter’s average processed oil (Kb/d).
The first ensemble prediction begins two years after the earliest available data, allowing sufficient history for training. Exponential Technology's final ensemble model outperforms both the base and error-tracking models with an improved MAPE of 3.13% (vs 4.94%)! This level of accuracy—achieved weeks before earnings releases—demonstrates how sophisticated quantitative investors are transforming Kpler's real-time refinery data into actionable trading signals.
The benefits are found in the ensemble's ability to eliminate the persistent upward or downward bias in the base and error tracking models and tighten the residual values compared to the error-tracking model. The ensemble model is shown to hug the reported figures tightly, with multiple near perfect predictions, and predict the dramatic fall and rise of production figures reported by PSX in the most recent two quarterly earnings releases.
Part 3
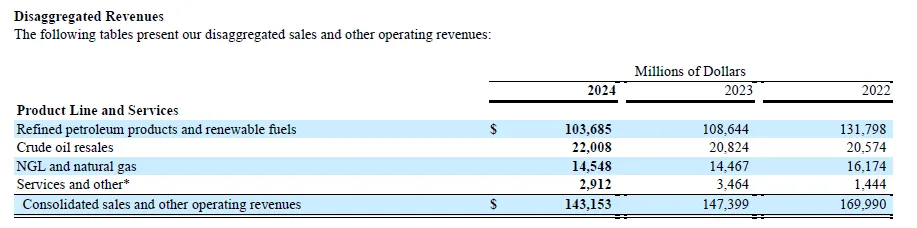
Once Exponential Technology developed their prediction model for earnings metrics, they moved onto applying this to the earnings themselves. Specifically, we aim to predict the “Refined petroleum products and renewable fuels” revenue segment as reported by PSX in their 10Q/K’s.
The results were remarkable: Exponential Technology's predicted revenue was within 3.1% of actual reported refining revenue. This level of precision, achieved using only Kpler's publicly available Refineries data as the foundation, validates both the quality of Kpler's datasets and the sophistication of Exponential Technology's analytical frameworks. The chart below shows the highly accurate forecasts.
Methodology
Exponential Technology's framework begins with robust estimates of quarterly refining production as discussed previously, expressed as thousands of barrels per day (Kb/d). These production forecasts, derived from Kpler’s granular daily data provides a strong foundation for downstream financial modeling. Revenue is then conceptualized as a function of the total volume processed and the revenue generated per barrel of oil refined.
To capture the relationship between refining economics and crude oil spot prices, we define the crack ratio as the ratio of revenue per barrel to the average spot price of West Texas Intermediate (WTI) crude during the quarter. This metric serves as a normalized proxy for refining margins. The calculation proceeds as follows:
- Compute the revenue per barrel processed:

Revenue per Barrel = Quarterly Revenue / (Production (kbd) * Days in Quarter) / 1000
- Derive the crack ratio:

Crack Ratio = Revenue per Barrel / Average WTI Spot Price
- Forecast the crack ratio for future quarters using time-series modeling.
- Generate the revenue forecast:

Where:
CR = Forecasted Crack Ratio
𝑝̂ = Estimated Production (kb/d)
n = calendar days in quarter
Illustrative example; consider a representative quarter (2024 -Q2) with the following data:
- Reported Refining revenue: $28,071 (millions)
- Reported refined products: 1780 Kb/d
- Days in quarter: 91
- Average WTI spot price: $81.84
- Revenue per Barrel = 28071 / ( (1780 * 91) / 1000) = 28071 / 161.98 ≈ 173.3
- Crack Ratio = 173.3 / 81.84 ≈ 2.12
By forecasting the crack ratio (via an ensemble method) and multiplying it by the estimated production and days, we obtain a revenue prediction that closely tracks actuals. For 2024-Q2 we estimated:
- Refining production: 1844
- Crack Ratio = 2.01
- Estimated Refining revenue = ( est refining production * est crack ratio * avg spot price * number of days in quarter) / 1000
= ( 1844 * 2.01* 81.84 * 91 ) / 1000 = $28,056.
Thus, our predicted revenue of $28,056 vs reported $28,071 is nearly perfect!
A Bold Prediction:
At the time of this blog’s writing (early/mid October, 2025) Exponential Technology has built models on three refiners, Phillips 66 (PSX), Valero (VLO), and PBF Energy (PBF). None of the three companies have reported earnings for Q3 2025 at the time of this blog’s writing.
Drawing on their model’s proven accuracy and proprietary ensemble techniques, Exponential Technology venture a forward-looking forecast for the upcoming quarterly earnings release.
These predictions represent the kind of pre-earnings intelligence that institutional investors use for positioning and risk management—demonstrating the real-world investment applications of Kpler's Refineries data.
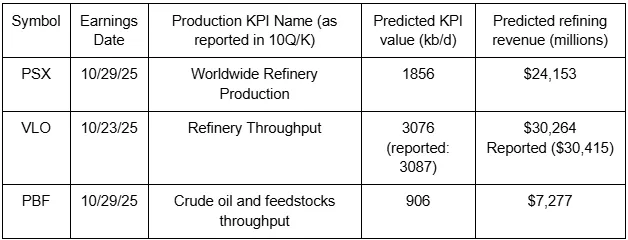
Note that VLO reported earnings before the blog was released publicly. That said our prediction for both throughput and refining revenue was within 0.5%, a near perfect hit of reported data!
Check back here after Phillips 66’ earnings to see how accurate Exponential Technology's prediction was and stay tuned for more updates coming soon.
The forthcoming white paper will include validation results, expanded case studies, and detailed methodologies for applying this framework to other sectors.
Refineries intelligence
Unlock real-time insights across 900+ global refineries with daily production data, utilisation rates, and gross margins to optimise your trading and operational strategies.
Book a demo to see how Kpler transforms refinery data into competitive advantage.

See why the most successful traders and shipping experts use Kpler

Unlock real-time insights across 900+ global refineries


.webp)


