High accuracy global crude oil storage
trusted by thousands of organisations worldwide


.webp)


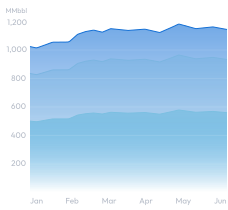
Oil inventories
China (Volume, by tank type)
100+
Countries covered
5bn+ barrels
Storage capacity monitored
5+
Year historical data
700+
Installations tracked
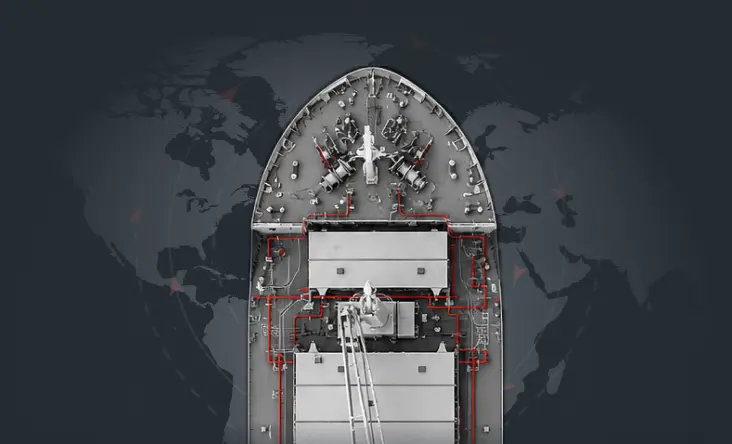
- Crude inventory tracking across tank farms, export terminals, strategic reserves, and major storage hubs globally — a single view of crude storage from major export terminals to strategic reserves
- Analyse builds and draws at site, country, regional, or global level — drill down or zoom out in seconds
- Monitor storage utilisation and evolving balances to stay ahead of tightening or loosening supply conditions
Request demo

- Detailed capacity and utilisation data for individual storage installations worldwide — identifying exactly which sites are filling up, which have room, and where constraints are emerging
- Operational tank usage and utilisation rates monitored at the site level
- Available versus constrained storage visibility across key crude hubs, including Cushing, Oklahoma
Request demo

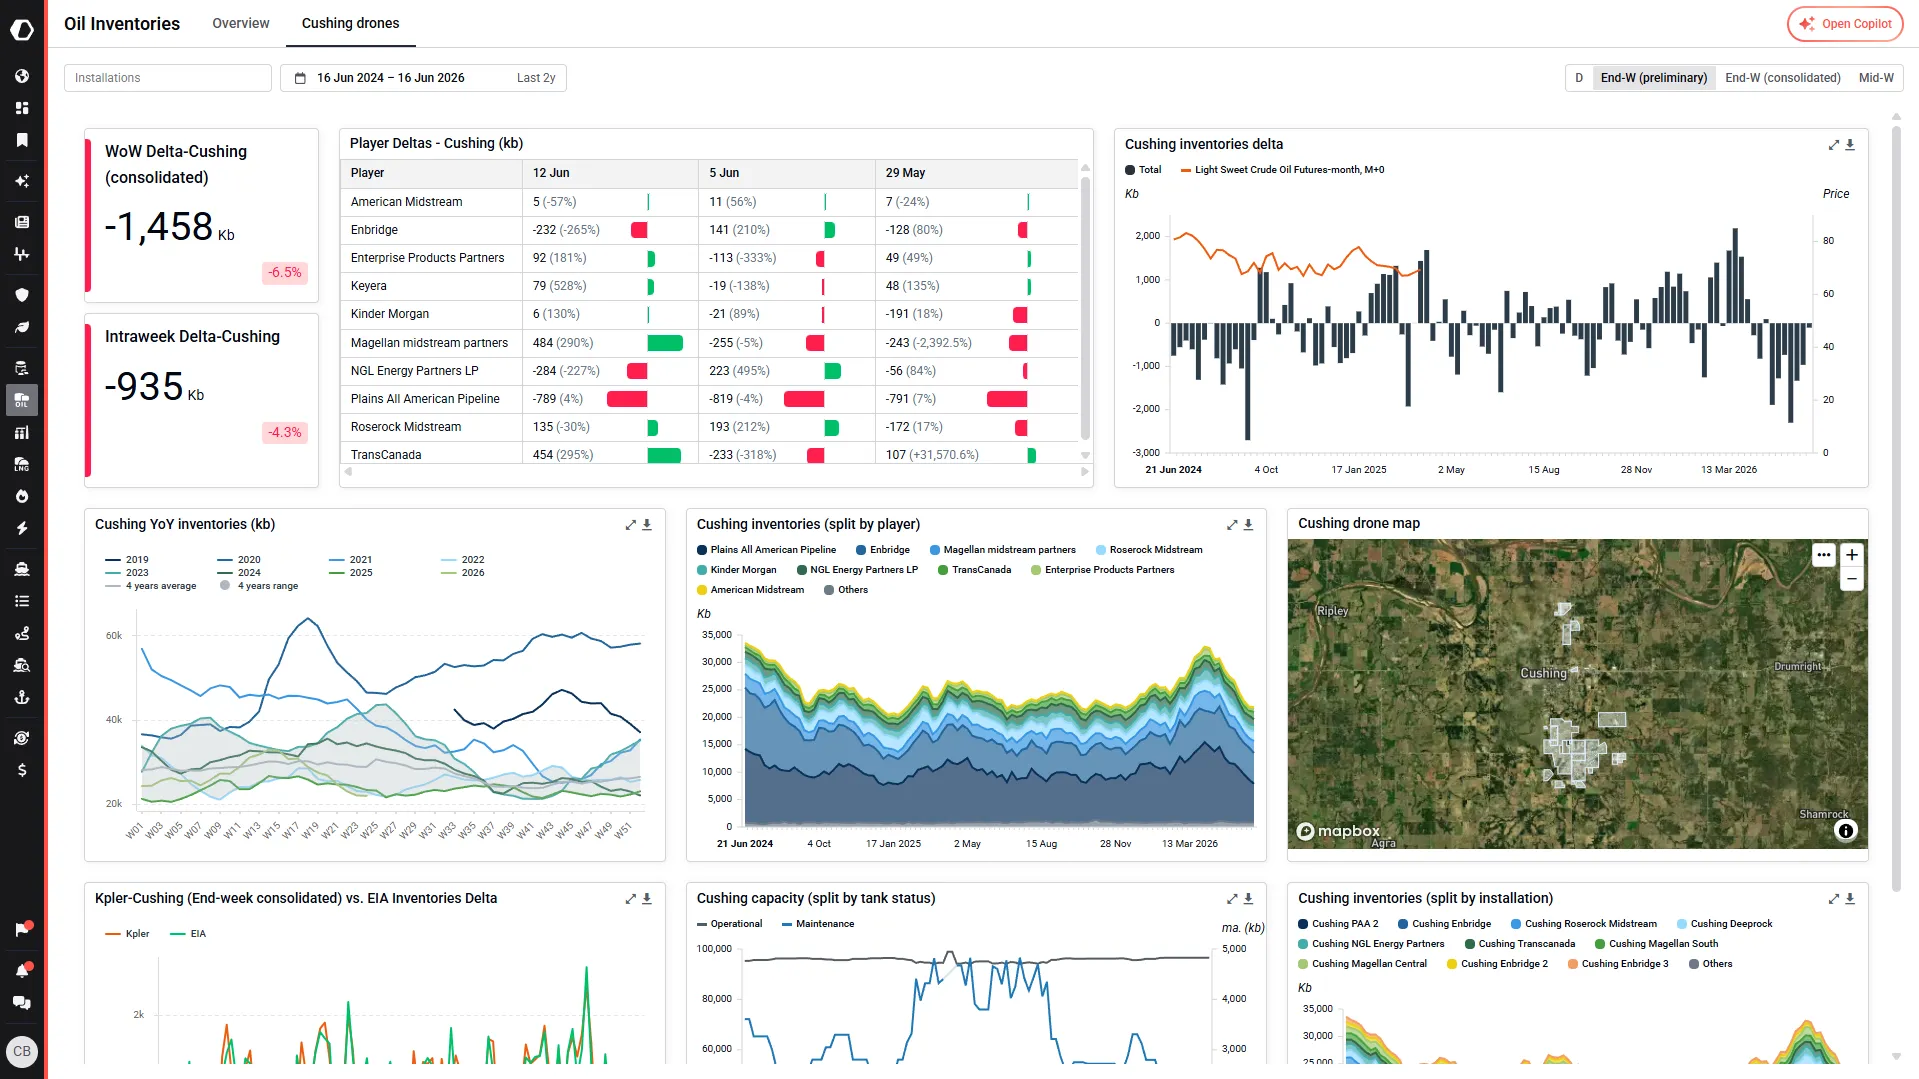
- Cushing inventories monitored using high-frequency drone and imaging intelligence — purpose-built for WTI traders
- Track stock movements and utilisation at the WTI futures delivery point with granularity that weekly EIA reports cannot match
Request demo
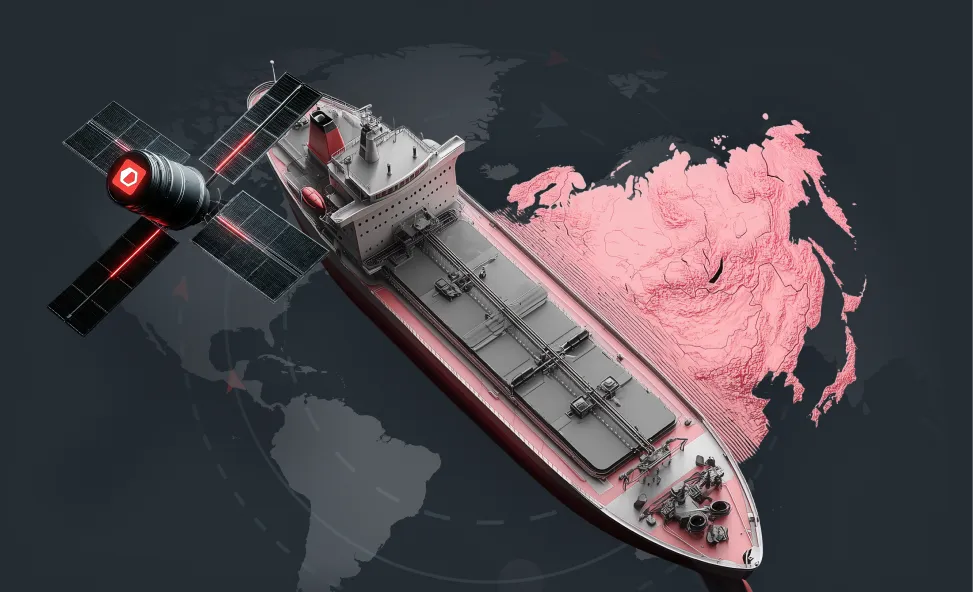
- Floating storage volumes and crude in transit between regions — tracking the barrels still at sea for a complete picture of incoming supply
- On-water barrels monitored alongside onshore inventories for a full view of available supply
- Identify incoming cargoes likely to drive future stock builds before they arrive
Request demo

- Compare crude inventories across major storage regions to identify where supply is tight and where it is building
- Analyse seasonal patterns, year-on-year changes, and long-term trends across 5+ years of historical data — separating signal from noise
- Spot relative regional tightness or oversupply early — before it shows up in price
Request demo

- Regularly updated crude inventory data across 100+ countries and 700+ storage installations — covering over 5.3 billion barrels of global storage capacity
- Consistent methodology across every region and storage type — no gaps when comparing markets
- The breadth of coverage matches the depth — a single, reliable dataset spanning the full global crude storage landscape
Request demo


“Best part? Kpler dashboards. I set up my metrics once, and they update in real-time. I can access the latest insights instantly.”
Broadview Capital
Director of Energy Research, Broadview Capital