.webp)


18 month
European TSO
5+
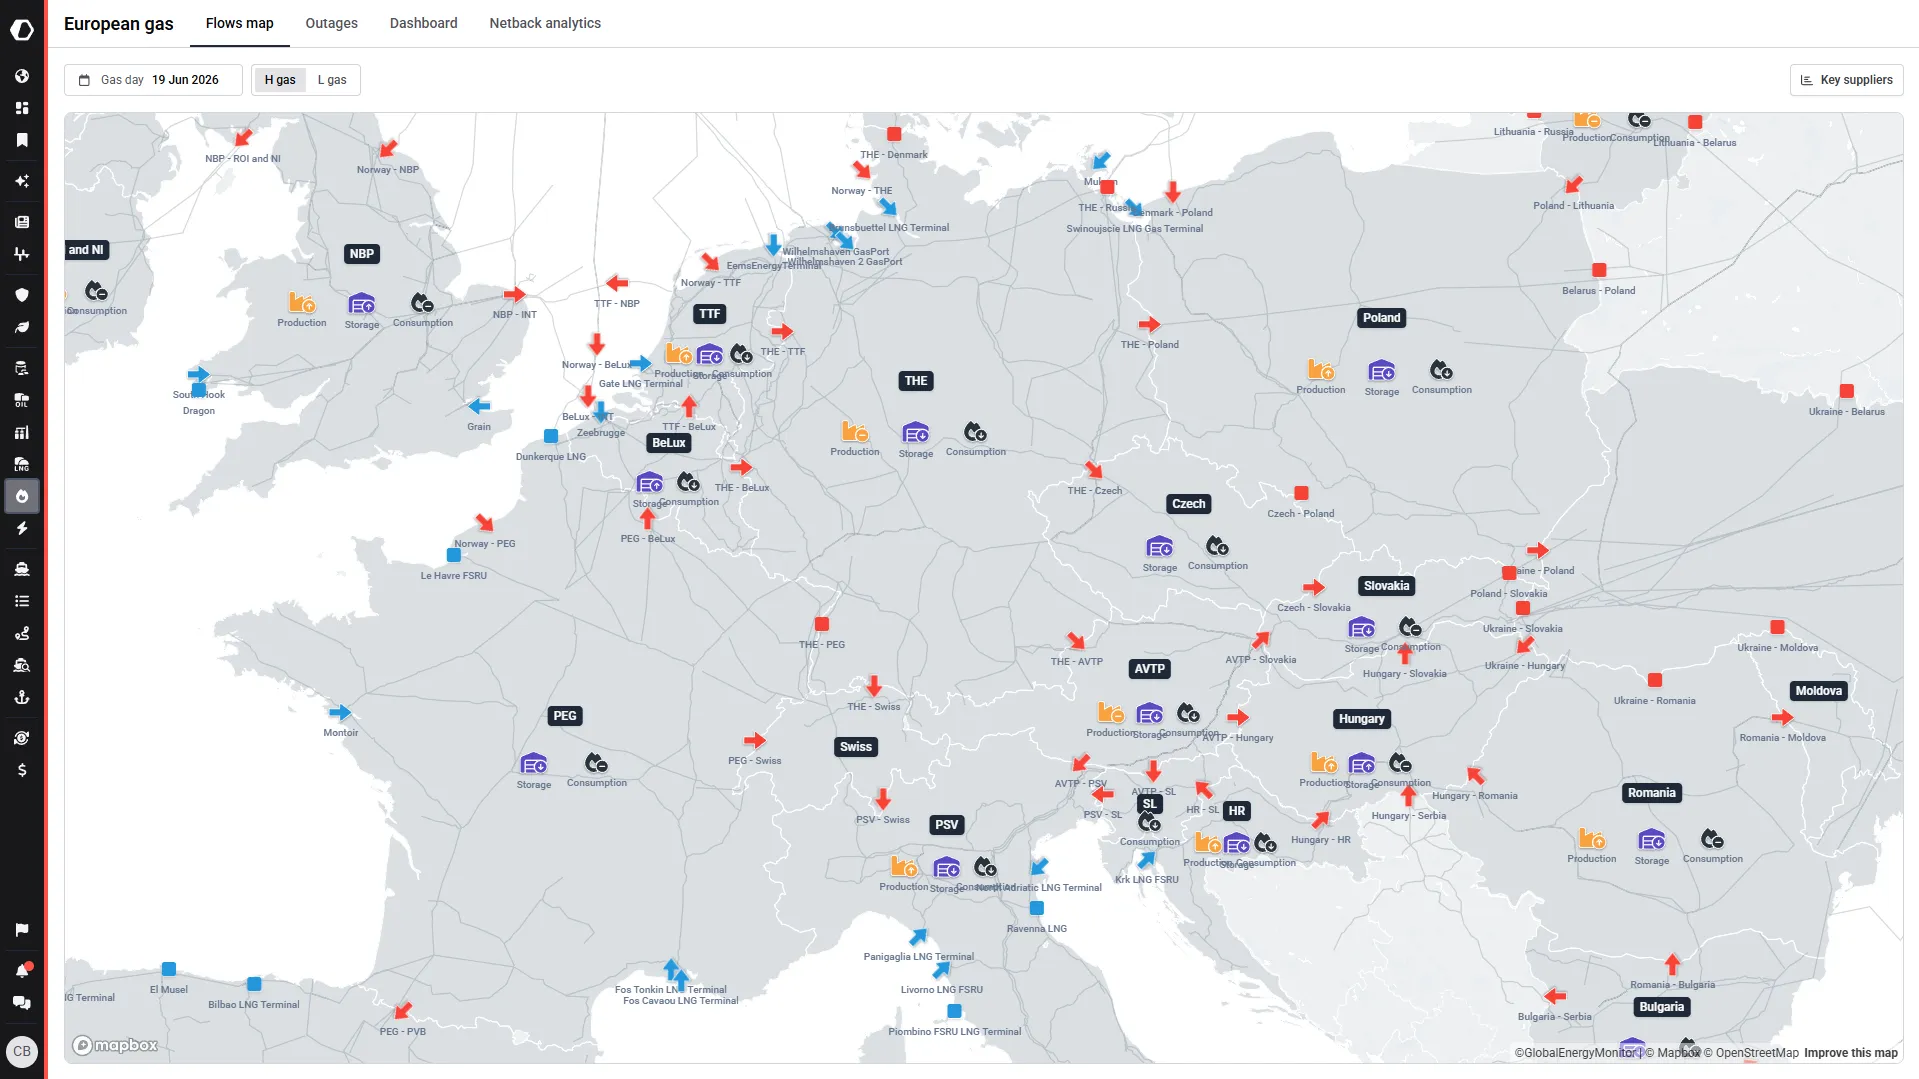
- Physical flow data across LNG terminals, underground storage, and pipelines — with daily capacity updates and maintenance schedules from 60+ European TSO sources, including up-to-date tariffs
- Supply and demand dashboards with smart visualisations for critical European gas fundamentals — tracking maintenance schedule changes day-on-day and past transmission capacity auction results
- Route calculator for strategic decision-making — compare hub spreads and route costs, integrate available transmission capacity, and monitor utilisation across key interconnectors and storage facilities
- Comprehensive US and European supply and demand analysis from a large team of unbiased experts — concise market calls with directional indicators and monthly balance summaries
- Regional flow and arbitrage insights covering domestic production, pipeline imports, LNG imports, and storage and infrastructure developments — delivered daily, weekly, and monthly
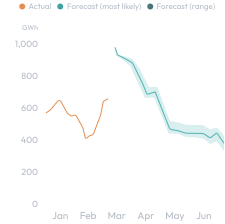
- Detailed European demand driver analysis across residential, industrial, and power sectors — with forecasts for nuclear and thermal power usage and underground gas storage inventories
- Proprietary, data-driven US domestic gas production across 4 key regions — with consumption data across residential, commercial, industrial, and power sectors, plus lease & plant fuel forecasts and pipeline & distribution use
- European natural gas balances covering domestic production, net pipeline imports for 5+ countries, and EU-27 domestic consumption forecasts
- LNG import forecasts and underground gas storage projections for a complete view of European market fundamentals

“Best part? Kpler dashboards. I set up my metrics once, and they update in real-time. I can access the latest insights instantly.”



FAQ
Kpler provides comprehensive natural gas market intelligence covering European and U.S. gas markets, including physical flows, infrastructure data, and supply-demand fundamentals.
Users can monitor:
- LNG terminal send-out and arrivals
- Underground gas storage inventories and capacity
- Pipeline flows across European interconnectors
- Transmission system operator (TSO) tariffs and capacity
- Transmission capacity auctions and maintenance schedules
Kpler aggregates data from more than 60 sources, enabling market participants to track the full gas value chain—from production and imports to consumption and storage.
Kpler tracks European natural gas flows by combining pipeline flow data, LNG terminal activity, and underground gas storage information.
Users can monitor:
- Pipeline flows between European countries
- LNG imports and regasification activity
- Gas storage injections, withdrawals, and inventories
- Interconnector utilization rates
The platform integrates daily updates from European Transmission System Operators (TSOs), allowing users to identify flow disruptions, maintenance events, and capacity constraints across the European gas network.
Kpler enables users to analyze both LNG imports and pipeline gas movements to understand how supply reaches European markets.
Market participants can track:
- LNG deliveries into European terminals
- Pipeline imports from neighboring regions
- Regional supply balances
- Cross-border gas flows across interconnectors
This visibility helps traders and analysts identify shifts in supply routes, infrastructure constraints, and emerging arbitrage opportunities.
Kpler provides detailed intelligence on key European gas infrastructure including:
- LNG terminals
- Underground gas storage facilities
- Pipeline interconnectors
- Transmission capacity auctions
Users can also monitor daily changes in maintenance schedules and infrastructure availability, helping them anticipate supply disruptions and adjust trading or operational strategies accordingly.
Kpler’s route calculator helps users identify the most efficient transportation routes for natural gas across Europe.
The tool allows users to:
- Compare hub price spreads
- Evaluate route transportation costs
- Incorporate available transmission capacity
- Analyze interconnector utilization
This functionality enables faster strategic decision-making and arbitrage analysis across European gas hubs.
Kpler provides research and market analysis covering U.S. and European natural gas markets.
The research team delivers:
- Daily, weekly, and monthly market reports
- Supply and demand analysis
- Storage outlooks and forecasts
- Infrastructure developments
- Directional market indicators and balance updates
These insights help market participants understand how production, imports, and demand drivers influence price dynamics.
Kpler’s natural gas supply and demand models combine infrastructure data, production estimates, and consumption forecasts.
For the United States, the model includes:
- Domestic gas production across key producing regions
- Consumption by residential, commercial, industrial, and power sectors
- Lease and plant fuel demand
- Pipeline and distribution usage
For Europe, Kpler provides:
- Domestic gas production balances
- Net pipeline imports across multiple countries
- LNG import forecasts
- Underground gas storage projections
- Consumption forecasts across key demand sectors