
Tankers: Top 5 market drivers in 2026
This article was first posted on Kpler Insight on 7 January.
The tanker market in 2026 will be shaped by supply growth, geopolitics, and demand uncertainty. OPEC+ production increases in 2025 boosted Middle East exports and VLCC rates, but rising inventories and a planned pause in output growth raise downside risks if demand weakens. Sanctioned crude exports reached multi-year highs, and the shadow fleet has become increasingly isolated, thoguh shifts in Venezuelan sanctions could trigger oversupply and scrapping. A normalisation of Red Sea transits would shorten voyage distances, pressuring LR2 and VLCC demand. Record tanker deliveries in 2026 add supply pressure, while slowing non-OPEC production limits long-haul Atlantic-to-Asia flows.
1. Will OPEC+ bring back more barrels?
The surge in Middle East crude exports from September lifted VLCC rates to a five-year high last year. The abundance of cargoes was directly linked to OPEC+ unwinding production cuts over the summer which made their way to exports from September. VLCC exports from the Middle East (excluding Iran) rose 1 Mbd between August and September to 15 Mbd, where they have since stabilized. This added approximately 12 additional VLCC loads per month.
Early 2026 will be a significant test for tankers as there are signs the market is struggling to absorb the increase in supply, with Chinese inventories hitting new highs and Brent edging lower.
Between September and November, the rally in VLCC rates was fueled by combined strength in demand from the Middle East and the Atlantic Basin. However, by December, Atlantic loadings had weakened sharply, placing increased pressure on the MEG to sustain rates. Continued OPEC+ production increases helped support export growth through Q4, but the group plans to pause further production increases from January.
A halt to further growth in exports from the Middle East will not necessarily result in long term pull back in rates as previous supply additions are now baked in. However, if the January pause is extended, it would signal that demand growth is insufficient. For tankers, rising onshore inventories and increased floating storage present downside risks, as eventual drawdowns could slow buying activity and reduce VLCC loadings.
MEG (ex-Iran) VLCC loads (count) and crude balance (Mbd)
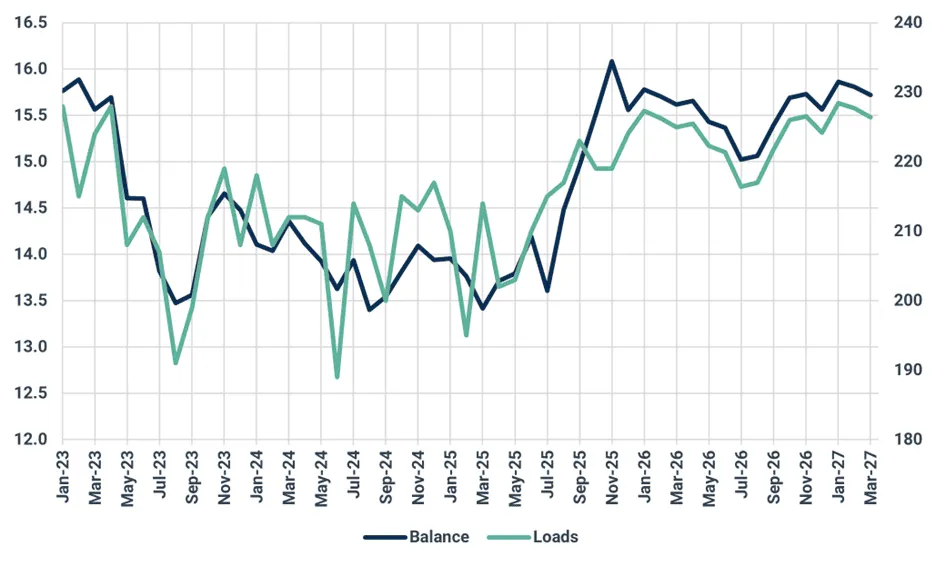
Source: Kpler
2. Will there be greater enforcement of the expanding sanctioned cargo market?
Crude exports from Iran, Venezuela and Russia rose 215 kbd m/m to 5.9 Mbd, the highest since 2018, making it the strongest year for sanctioned exporters since restrictions were introduced.
Growth in exports drew move vessels into the sanctioned trade market. In total, tankers that loaded cargoes from Iran, Venezuela and Russia in 2025 accounted for 27% of the tanker fleet (or 14% of cargoes) for vessels that are MR or larger. Crucially, 46% of these vessels solely loaded sanctioned cargoes in 2025, up from 40% in 2024, signalling that vessels are increasingly dedicated to the sanctioned cargo market and isolated from the commercial market.
The increase in sanctioned cargo exports last year was mirrored by a significant increase in sanctions targeting vessels but also, ports, terminals and refineries. In 2025, 623 vessels were added to sanction lists for the first time, up from 255 in 2024. This has been somewhat successful as the data show vessel ton-miles decline after being sanctioned. However, the effect of this is mixed, with OFAC proving far more effective than EU/UK sanctions. US OFAC sanctions overwhelmingly targeted vessels handling Iranian and Venezuelan trade, while EU and UK sanctions went after vessels breaching the Russian price cap.
It was the escalation in vessel sanctions which has led to the rising share of vessels solely loading sanctioned cargoes, particularly from Russia which had a much larger flexible fleet in previous years. The prospect of an end to the price cap would further split the shadow fleet from the commercial fleet, transforming tanker supply dynamics.
US action in Venezuela at the start of the year will likely mean Venezuelan crude exports shift to the commercial tanker market, a huge blow to shadow fleet demand. We expect this to result in an oversupply of shadow fleet VLCCs, leading to scrapping.
Fleet serving Iran, Venezuela & Russia
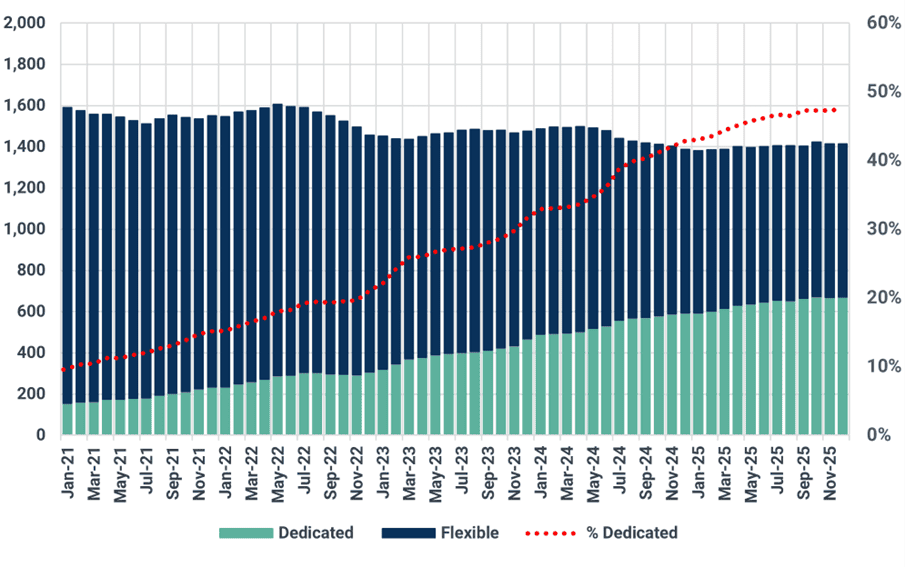
Source: Kpler
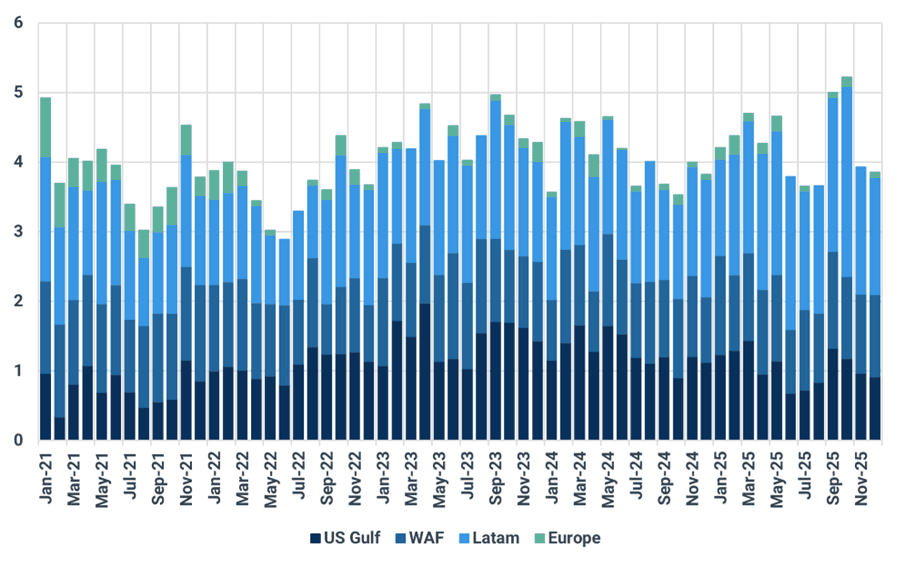
3. Return to normalised Red Sea transits threatens LR2 rates
Houthi attacks on commercial shipping in the Red Sea transformed crude and refined product trade flows in recent years. Rerouting around the Cape of Good Hope was a major source of tanker demand growth in 2024. But in 2025, East to West ton-miles fell, driven by weaker intra-basin flows and softer European import demand.
An additional contributor to this decline was the recovery in Suez Canal transits, which reached their highest levels since the attacks began. In the chart below, Russian flows are excluded, as these have largely continued through the Red Sea uninterrupted, providing a clearer view of trade normalization. Total liquid flows through the Suez Canal have recovered to 1.4 mbd but remain approximately 2.7 mbd below 2023 levels.
Liquid cargoes through the Suez Canal (excluding Red Sea and Russian origin)
While peace in the region remains fragile, assuming the current ceasefire holds and no further attacks occur, we expect steady growth in Suez Canal transits through the first half of 2026. Flows are unlikely to return fully to 2023 levels due to weaker demand and the structural embedding of some alternative trade routes. We expect increased Middle East crude flows into the Mediterranean, displacing cargoes from the US and other Atlantic suppliers. For crude, this should support Suezmax demand at the expense of VLCCs routing via the Cape and Aframax demand in the Atlantic. On the clean side, LR2 demand is likely to weaken as voyage durations from the Middle East and India to Europe shorten.
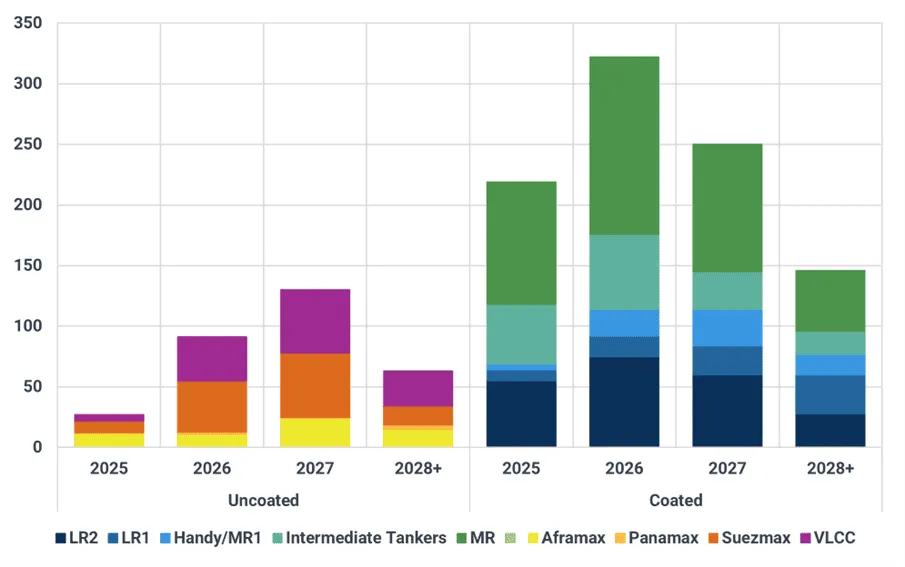
4. Record year for tanker fleet growth adds supply concerns
Tanker deliveries rose in 2025 after a few years of lower fleet replenishment but 2026 is set to be a record year for tanker deliveries. This year we expect 419 tankers from Intermediates to VLCCs to hit the water, up from 247 in 2025, a 52% increase.
Growth in coated tankers is set to account for the bulk of new arrivals, with 146 MRs slated for delivery. However, all major segments will see multi-year highs in deliveries. This surge reflects ordering activity in 2024, when tanker rates spiked due to the combined effects of the Red Sea crisis and the Russia-Ukraine war.
MR rates will likely face the most pressure from the increase in supply, but over 50 vessels will move into the 20+ year old category, making them prime candidates for scrapping, should market conditions deteriorate.
The dirty segment is scheduled to see higher deliveries in 2027, but for VLCCs there will be a notable jump in 2026, with 38 expected to arrive, up from eight in 2025. Strong demand from the dark fleet and lower utilization of aging tonnage suggest these additions are unlikely to materially pressure rates, particularly if demand remains robust.
Tanker deliveries by year
Source: Kpler
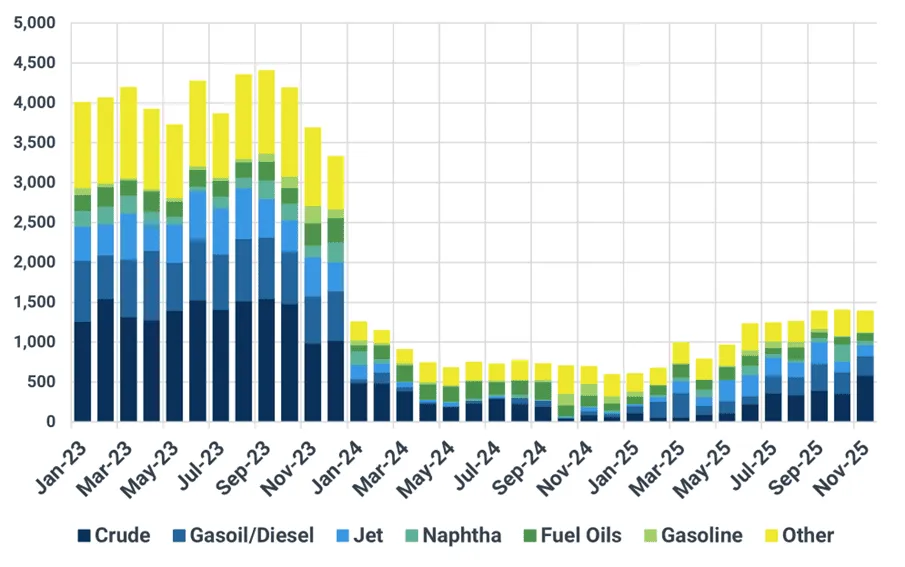
5. How will lower non-OPEC production impact tanker demand?
In 2025, non-OPEC+ crude exports rose 380 kbd y/y to 15.3 Mbd (+2.45%) adding to the growing crude surplus. Brazil, Canada, Guyana and Argentina were the main contributors to growth, with most of the remainder posting y/y declines.
Despite this export growth, non-OPEC+ ton-miles rose by just 25 billion (+0.65%). The muted ton-mile response reflects a higher share of Atlantic Basin exports remaining within the West, compared with previous years.
Non-OPEC+ production growth is expected to slow in 2026, with gains early in the year offset by declines in the second half. By late 2025, the West-East arbitrage had come under pressure due to rising Middle East supply and lower OSPs aimed at defending Asian market share. This dynamic is expected to persist into 2026, limiting long-haul VLCC movements to Asia.
As production declines in 2H26, we anticipate further reductions in long-haul Atlantic-to-Asia flows. This will act as a counterbalance to otherwise supportive fundamentals driven by Middle East export growth.
Atlantic basin VLCC exports to to Asia (kbd)
Source: Kpler
Want market insights you can actually trust?
Kpler delivers unbiased, expert-driven intelligence that helps you to track critical crude oil market developments for your own analysis. Our precise forecasting empowers smarter trading and risk management decisions.
Unbiased. Data-driven. Essential. Request access to Kpler today.

See why the most successful traders and shipping experts use Kpler