Discover more with Kpler’s freight supply chain visibility and analytics solution.
trusted by thousands of organisations worldwide


.webp)


Freight Analytics
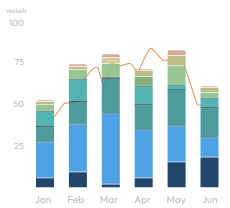
Panama Canal, Tonnage Supply (by vessel type)
5+
Year history
1.2bn+
AIS positions processed daily
36k+
Commodity vessels monitored
- Access real-time global port congestion data to understand how long and how many vessels are congesting an area to plan around obstacles
- Analyse canal congestion data for key locations such as Panama, Suez, and more, with data powered by the largest AIS network in the world
- Filter between true congestion and vessels in the waiting zone for other purposes, ensuring that you always have a clear picture of reality
Request demo

- Explore comprehensive freight analytics including ton-miles, ton-days, average speed and average distance
- Split key performance data by laden and ballast statuses to understand where market factors like ton-mile demand and average ballast speed are pulling the market
- Utilise a 5+ year history across the global commodity fleet to build contextual and comparative performance indicators
Request demo

- Gain a reliable overview of future tonnage availability across regions, countries and ports.Use reliable data for open, potentially open, fixed, and potentially fixed vessels to evaluate chartering opportunities in real-time
- Evaluate historical ballast capacity through historical Point-in-Time data for crucial freight market insight
- Slice data according to vessel types, cargo on board and more across 36k+ vessels to unlock powerful analytics
Request demo

- Analyse laden vs. ballast statuses across the global commodity fleet in order to gain key indicators of supply & demand
- Utilise powerful directional features to analyse trends in regional supply & demand, such as investigating where ballasted vessels will head next
- Incorporate floating storage vessels to gain a clear sense of fleet utilisation within any vessel class
- Identify detailed vessel data such as dirty and clean statuses, floating production storage and offloading vessels, or floating storage regasification units
Request demo

- Examine historical and future statistics for vessel deliveries, orders, and scrapping lists to analyse the global fleet supply
- Access new vessel deliveries based on monthly aggregated data build dates from fleet registries
- Monitor aggregated data on vessels sold for demolition based on dead dates
- Track fleet compliance and get weekly updates on vessel scrubber strategies and installations
Request demo

- Compare available vessels in a specific future time window against historical availability — assessing whether more or fewer are ballasting to particular regions
- Overlay freight rate data with historical vessel trends to support more strategic chartering and trading decisions
- Tonnage supply insights across bulkers, tankers, and gas carriers — spanning regions, countries, and ports regardless of cargo type
- Freight calculator to evaluate voyages and build itineraries — with inputs across vessel details, canal crossings, ECA zones, HRA zones, and bunker costs for VLSFO, IFO380, and MGO
Request demo


“Best part? Kpler dashboards. I set up my metrics once, and they update in real-time. I can access the latest insights instantly.”
Broadview Capital
Director of Energy Research, Broadview Capital